## Chart/Diagram Type: Combined Line Graph and Heatmap
### Overview
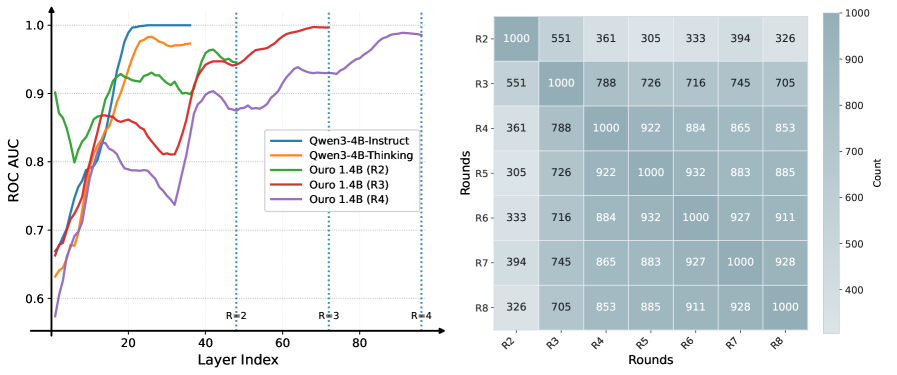
The image presents a combination of a line graph and a heatmap. The line graph, located on the left, displays the ROC AUC (Receiver Operating Characteristic Area Under the Curve) for different language models across various layer indices. The heatmap, on the right, shows the count of interactions or relationships between different rounds (R2 to R8).
### Components/Axes
**Line Graph:**
* **X-axis:** Layer Index (ranging from approximately 0 to 90)
* **Y-axis:** ROC AUC (ranging from 0.6 to 1.0)
* **Legend (top-right of the line graph):**
* Blue: Qwen3-4B-Instruct
* Orange: Qwen3-4B-Thinking
* Green: Ouro 1.4B (R2)
* Red: Ouro 1.4B (R3)
* Purple: Ouro 1.4B (R4)
* Vertical dotted lines at Layer Index ~50, ~70, and ~85, labeled "R=2", "R=3", and "R=4" respectively.
**Heatmap:**
* **X-axis:** Rounds (R2, R3, R4, R5, R6, R7, R8)
* **Y-axis:** Rounds (R2, R3, R4, R5, R6, R7, R8)
* **Color Scale (right of the heatmap):** Represents "Count," ranging from 400 to 1000. Darker shades indicate higher counts.
### Detailed Analysis or ### Content Details
**Line Graph Data:**
* **Qwen3-4B-Instruct (Blue):** Starts at approximately 0.65 ROC AUC, rises sharply to 1.0 around Layer Index 20, and remains at 1.0 for the rest of the layers.
* **Qwen3-4B-Thinking (Orange):** Starts at approximately 0.65 ROC AUC, rises sharply to approximately 0.98 around Layer Index 20, then decreases slightly to approximately 0.95 and remains relatively stable.
* **Ouro 1.4B (R2) (Green):** Starts at approximately 0.70 ROC AUC, rises to approximately 0.95 around Layer Index 20, then fluctuates between 0.90 and 0.95.
* **Ouro 1.4B (R3) (Red):** Starts at approximately 0.65 ROC AUC, rises to approximately 0.90 around Layer Index 20, dips to approximately 0.80 around Layer Index 40, and then rises again to approximately 0.98.
* **Ouro 1.4B (R4) (Purple):** Starts at approximately 0.60 ROC AUC, rises to approximately 0.80 around Layer Index 15, dips to approximately 0.72 around Layer Index 35, and then rises again to approximately 0.98.
**Heatmap Data:**
The heatmap represents a matrix of counts between rounds. The diagonal elements (R2-R2, R3-R3, etc.) are all 1000, indicating a perfect correlation or maximum count within the same round.
| | R2 | R3 | R4 | R5 | R6 | R7 | R8 |
| :---- | :--- | :--- | :--- | :--- | :--- | :--- | :--- |
| **R2** | 1000 | 551 | 361 | 305 | 333 | 394 | 326 |
| **R3** | 551 | 1000 | 788 | 726 | 716 | 745 | 705 |
| **R4** | 361 | 788 | 1000 | 922 | 884 | 865 | 853 |
| **R5** | 305 | 726 | 922 | 1000 | 932 | 883 | 885 |
| **R6** | 333 | 716 | 884 | 932 | 1000 | 927 | 911 |
| **R7** | 394 | 745 | 865 | 883 | 927 | 1000 | 928 |
| **R8** | 326 | 705 | 853 | 885 | 911 | 928 | 1000 |
### Key Observations
* The Qwen3-4B-Instruct model achieves the highest ROC AUC and stabilizes quickly.
* The Ouro 1.4B models show more fluctuation in ROC AUC across different layer indices.
* The heatmap shows that rounds closer to each other (e.g., R4 and R5) have higher counts compared to rounds further apart (e.g., R2 and R8).
* The diagonal of the heatmap is always 1000, indicating perfect correlation within the same round.
### Interpretation
The line graph suggests that the Qwen3-4B-Instruct model is the most effective in terms of ROC AUC, achieving high performance early in the layers. The Ouro 1.4B models, particularly R3 and R4, exhibit more variability, suggesting that their performance is more sensitive to the specific layer index.
The heatmap indicates the degree of interaction or relationship between different rounds. The higher counts between adjacent rounds suggest that these rounds are more closely related or have more similar characteristics. The lower counts between distant rounds suggest less similarity or interaction. The perfect correlation within each round (diagonal values of 1000) is expected.