## Line Chart & Heatmap: Model Performance vs. Layer Index & Round
### Overview
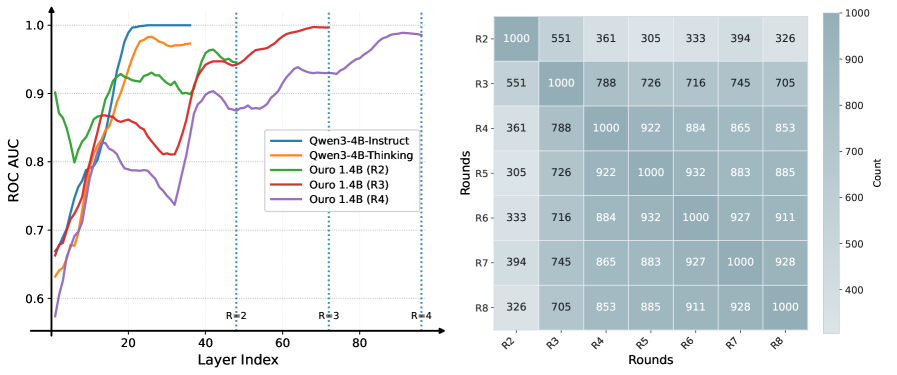
The image presents a combined visualization of two charts. The left side is a line chart showing the ROC AUC (Receiver Operating Characteristic Area Under the Curve) as a function of Layer Index for different models. The right side is a heatmap displaying the Count of occurrences for different combinations of Rounds (R2 to R8). A vertical dashed line separates the two charts.
### Components/Axes
**Line Chart:**
* **X-axis:** Layer Index (ranging from approximately 0 to 90). Marked with vertical dashed lines at Layer Index values of approximately 50, 60, and 80, labeled as R=2, R=3, and R=4 respectively.
* **Y-axis:** ROC AUC (ranging from approximately 0.6 to 1.0).
* **Data Series:**
* Qwen3-4B-Instruct (Blue)
* Qwen3-4B-Thinking (Orange)
* Ouro 1.4B (R2) (Green)
* Ouro 1.4B (R3) (Red)
* Ouro 1.4B (R4) (Purple)
* **Legend:** Located in the top-left corner, associating colors with model names.
**Heatmap:**
* **X-axis:** Rounds (R2, R3, R4, R5, R6, R7, R8)
* **Y-axis:** Rounds (R2, R3, R4, R5, R6, R7, R8)
* **Color Scale:** Ranges from approximately 400 to 1000, representing the Count. The color scale is positioned on the right side of the heatmap.
* **Data Values:** Numerical values are displayed within each cell of the heatmap.
### Detailed Analysis or Content Details
**Line Chart:**
* **Qwen3-4B-Instruct (Blue):** Starts at approximately 0.65 ROC AUC at Layer Index 0, increases steadily to approximately 0.95 at Layer Index 40, then fluctuates between 0.9 and 1.0 until Layer Index 90.
* **Qwen3-4B-Thinking (Orange):** Starts at approximately 0.65 ROC AUC at Layer Index 0, increases rapidly to approximately 0.98 at Layer Index 20, then decreases slightly to approximately 0.95 at Layer Index 40, and remains relatively stable around 0.95-1.0 until Layer Index 90.
* **Ouro 1.4B (R2) (Green):** Starts at approximately 0.65 ROC AUC at Layer Index 0, increases to approximately 0.9 at Layer Index 20, then decreases to approximately 0.75 at Layer Index 40, and increases again to approximately 0.85 at Layer Index 90.
* **Ouro 1.4B (R3) (Red):** Starts at approximately 0.65 ROC AUC at Layer Index 0, increases rapidly to approximately 1.0 at Layer Index 20, and remains relatively stable around 1.0 until Layer Index 90.
* **Ouro 1.4B (R4) (Purple):** Starts at approximately 0.65 ROC AUC at Layer Index 0, increases to approximately 0.9 at Layer Index 20, then decreases to approximately 0.7 at Layer Index 40, and increases again to approximately 0.8 at Layer Index 90.
**Heatmap:**
The heatmap displays the count of occurrences for each combination of Rounds. The values are as follows:
| | R2 | R3 | R4 | R5 | R6 | R7 | R8 |
| :---- | :--- | :--- | :--- | :--- | :--- | :--- | :--- |
| **R2** | 551 | 361 | 305 | 333 | 394 | 326 | |
| **R3** | 551 | 788 | 726 | 716 | 745 | 705 | |
| **R4** | 361 | 788 | 922 | 884 | 865 | 853 | |
| **R5** | 305 | 726 | 922 | 932 | 883 | 885 | |
| **R6** | 333 | 716 | 884 | 932 | 927 | 911 | |
| **R7** | 394 | 745 | 865 | 883 | 927 | 928 | |
| **R8** | 326 | 705 | 853 | 885 | 911 | 928 | 1000 |
### Key Observations
* The Qwen3-4B-Thinking model consistently exhibits the highest ROC AUC values, particularly after Layer Index 20.
* The Ouro 1.4B models (R2, R3, R4) show more variability in ROC AUC, with R3 generally performing the best.
* The heatmap shows a generally increasing count of occurrences as the Rounds increase, suggesting a trend towards more frequent combinations of higher Rounds.
* The highest count (1000) is observed for R8-R8, indicating the most frequent combination of rounds is R8 with itself.
* The heatmap is symmetric along the diagonal, indicating that the counts are similar for the same round number.
### Interpretation
The line chart suggests that the Qwen3-4B-Thinking model demonstrates superior performance compared to the other models, especially as the Layer Index increases. This could indicate that the "Thinking" approach is more effective at leveraging deeper layers in the model. The Ouro 1.4B models show varying performance, potentially due to differences in their training or architecture. The heatmap reveals that higher rounds are more common, which could be related to the training process or the nature of the task being evaluated. The high count for R8-R8 suggests that this combination of rounds is particularly prevalent or optimal.
The combination of these two charts provides insights into both the model's performance over layers and the distribution of rounds used during evaluation or training. The data suggests a potential correlation between model performance and the depth of the layers, as well as a preference for higher rounds. Further investigation would be needed to understand the underlying reasons for these observations and to optimize the model's performance.