## Chart Type: Multiple Line Graphs Comparing Training Performance
### Overview
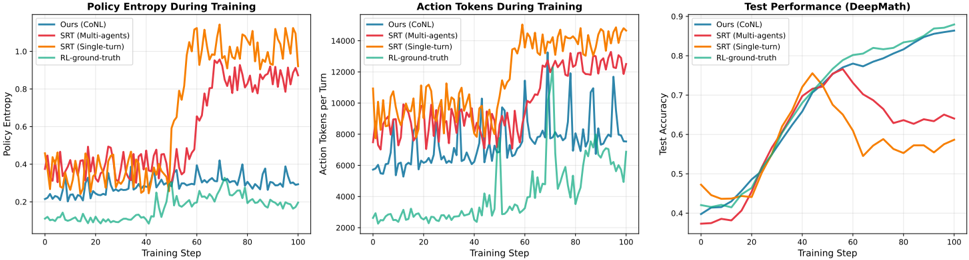
The image presents three line graphs comparing the performance of different training methods: "Ours (CoNL)", "SRT (Multi-agents)", "SRT (Single-turn)", and "RL-ground-truth". The graphs depict "Policy Entropy During Training", "Action Tokens During Training", and "Test Performance (DeepMath)" across training steps.
### Components/Axes
**Graph 1: Policy Entropy During Training**
* **Title:** Policy Entropy During Training
* **Y-axis:** Policy Entropy, ranging from 0.0 to 1.0 in increments of 0.2.
* **X-axis:** Training Step, ranging from 0 to 100 in increments of 20.
* **Legend (Top-Left):**
* Blue: Ours (CoNL)
* Red: SRT (Multi-agents)
* Orange: SRT (Single-turn)
* Teal: RL-ground-truth
**Graph 2: Action Tokens During Training**
* **Title:** Action Tokens During Training
* **Y-axis:** Action Tokens per Turn, ranging from 2000 to 14000 in increments of 2000.
* **X-axis:** Training Step, ranging from 0 to 100 in increments of 20.
* **Legend (Top-Left):**
* Blue: Ours (CoNL)
* Red: SRT (Multi-agents)
* Orange: SRT (Single-turn)
* Teal: RL-ground-truth
**Graph 3: Test Performance (DeepMath)**
* **Title:** Test Performance (DeepMath)
* **Y-axis:** Test Accuracy, ranging from 0.4 to 0.9 in increments of 0.1.
* **X-axis:** Training Step, ranging from 0 to 100 in increments of 20.
* **Legend (Top-Left):**
* Blue: Ours (CoNL)
* Red: SRT (Multi-agents)
* Orange: SRT (Single-turn)
* Teal: RL-ground-truth
### Detailed Analysis
**Graph 1: Policy Entropy During Training**
* **Ours (CoNL) (Blue):** Stays relatively constant around 0.3.
* **SRT (Multi-agents) (Red):** Starts around 0.35, increases to approximately 0.5 around step 50, then increases again to approximately 0.8 around step 70, then fluctuates between 0.8 and 0.9.
* **SRT (Single-turn) (Orange):** Starts around 0.3, increases sharply around step 50 to approximately 1.0, then fluctuates between 0.9 and 1.1.
* **RL-ground-truth (Teal):** Starts around 0.1, increases gradually to approximately 0.25 by step 100.
**Graph 2: Action Tokens During Training**
* **Ours (CoNL) (Blue):** Fluctuates between approximately 4000 and 8000.
* **SRT (Multi-agents) (Red):** Fluctuates between approximately 8000 and 12000.
* **SRT (Single-turn) (Orange):** Fluctuates between approximately 10000 and 14000.
* **RL-ground-truth (Teal):** Fluctuates between approximately 2000 and 4000.
**Graph 3: Test Performance (DeepMath)**
* **Ours (CoNL) (Blue):** Increases steadily from approximately 0.4 to 0.85.
* **SRT (Multi-agents) (Red):** Increases from approximately 0.38 to a peak of approximately 0.75 around step 50, then decreases and fluctuates between 0.6 and 0.65.
* **SRT (Single-turn) (Orange):** Increases from approximately 0.4 to a peak of approximately 0.78 around step 40, then decreases and fluctuates between 0.5 and 0.6.
* **RL-ground-truth (Teal):** Increases steadily from approximately 0.4 to 0.9.
### Key Observations
* In the Policy Entropy graph, SRT (Single-turn) and SRT (Multi-agents) show a significant increase in entropy during training, while Ours (CoNL) remains relatively stable. RL-ground-truth shows a gradual increase.
* In the Action Tokens graph, SRT (Single-turn) consistently uses the most action tokens, followed by SRT (Multi-agents), Ours (CoNL), and RL-ground-truth.
* In the Test Performance graph, RL-ground-truth and Ours (CoNL) achieve the highest test accuracy, while SRT (Single-turn) and SRT (Multi-agents) peak earlier and then plateau or decrease.
### Interpretation
The graphs suggest that while SRT (Single-turn) and SRT (Multi-agents) initially perform well, their performance plateaus or decreases in terms of test accuracy, possibly due to increased entropy and a higher number of action tokens used. Ours (CoNL) and RL-ground-truth, on the other hand, show more stable and ultimately better test performance, indicating a more effective learning process for the DeepMath task. The higher action tokens used by SRT methods might indicate less efficient strategies. The policy entropy results suggest that the SRT methods explore a wider range of actions, which might lead to instability in the long run.