\n
## Line Charts: Training Performance Comparison
### Overview
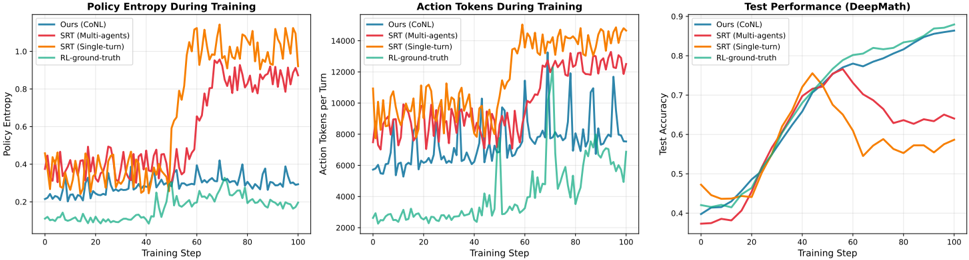
The image presents three line charts displayed side-by-side, comparing the performance of four different reinforcement learning algorithms during training. The charts track Policy Entropy, Action Tokens per Turn, and Test Performance (DeepMath) over 100 training steps. Each chart uses the same color scheme to represent the four algorithms: Ours (CoNL), SRT (Multi-agents), SRT (Single-turn), and RL-ground-truth.
### Components/Axes
Each chart shares the following components:
* **X-axis:** Training Step (ranging from 0 to 100, with increments of 10)
* **Y-axis:** Varies depending on the chart:
* Chart 1: Policy Entropy (ranging from approximately 0.1 to 0.9, with increments of 0.1)
* Chart 2: Action Tokens per Turn (ranging from approximately 2000 to 14000, with increments of 2000)
* Chart 3: Test Accuracy (ranging from approximately 0.35 to 0.9, with increments of 0.05)
* **Legend:** Located at the top-left of each chart, identifying the algorithms by color:
* Ours (CoNL) - Teal
* SRT (Multi-agents) - Blue
* SRT (Single-turn) - Red
* RL-ground-truth - Orange
### Detailed Analysis or Content Details
**Chart 1: Policy Entropy During Training**
* **Ours (CoNL) - Teal:** The line fluctuates around a low value, approximately 0.2, with minor oscillations.
* **SRT (Multi-agents) - Blue:** The line starts at approximately 0.4 and remains relatively stable, with slight variations.
* **SRT (Single-turn) - Red:** The line begins at approximately 0.5 and exhibits a significant upward trend, reaching a peak of around 0.85 at step 60, then decreasing slightly to approximately 0.75 at step 100.
* **RL-ground-truth - Orange:** The line starts at approximately 0.6 and shows a strong upward trend, peaking at around 0.9 at step 60, then decreasing to approximately 0.8 at step 100.
**Chart 2: Action Tokens During Training**
* **Ours (CoNL) - Teal:** The line fluctuates around a value of approximately 3000, with oscillations.
* **SRT (Multi-agents) - Blue:** The line starts at approximately 4000 and remains relatively stable, with minor variations.
* **SRT (Single-turn) - Red:** The line begins at approximately 6000 and exhibits a fluctuating pattern, generally staying between 6000 and 10000.
* **RL-ground-truth - Orange:** The line starts at approximately 8000 and shows a fluctuating pattern, generally staying between 8000 and 14000.
**Chart 3: Test Performance (DeepMath)**
* **Ours (CoNL) - Teal:** The line starts at approximately 0.4 and exhibits a steady upward trend, reaching approximately 0.75 at step 100.
* **SRT (Multi-agents) - Blue:** The line starts at approximately 0.4 and shows a rapid upward trend, reaching approximately 0.85 at step 60, then leveling off slightly to approximately 0.8 at step 100.
* **SRT (Single-turn) - Red:** The line begins at approximately 0.4 and exhibits a slow upward trend, reaching approximately 0.6 at step 100.
* **RL-ground-truth - Orange:** The line starts at approximately 0.4 and shows a rapid upward trend, peaking at approximately 0.9 at step 40, then decreasing to approximately 0.65 at step 100.
### Key Observations
* The "RL-ground-truth" algorithm consistently demonstrates the highest policy entropy and action tokens per turn, indicating a more exploratory behavior.
* "SRT (Multi-agents)" and "Ours (CoNL)" show relatively stable policy entropy and action tokens per turn.
* "SRT (Single-turn)" exhibits the most significant increase in policy entropy during training.
* In terms of test accuracy, "SRT (Multi-agents)" initially outperforms the other algorithms, but its performance plateaus after step 60. "Ours (CoNL)" shows a consistent improvement in test accuracy throughout the training process.
* "RL-ground-truth" achieves high test accuracy initially but experiences a decline in performance towards the end of the training process.
### Interpretation
The charts suggest that the "Ours (CoNL)" algorithm demonstrates a balanced approach to exploration and exploitation, as evidenced by its moderate policy entropy and consistent improvement in test accuracy. The "SRT (Multi-agents)" algorithm achieves high initial test accuracy but may suffer from overfitting or a lack of continued learning. The "RL-ground-truth" algorithm, while exhibiting high exploration, may not generalize well to unseen data, as indicated by its declining test accuracy. The "SRT (Single-turn)" algorithm's increasing policy entropy suggests it is becoming more exploratory, but its test accuracy remains relatively low.
The relationship between the charts is evident: higher policy entropy and action tokens per turn often correlate with increased exploration, which can lead to higher initial test accuracy but may also result in decreased generalization performance. The optimal algorithm appears to be one that balances exploration and exploitation to achieve both high test accuracy and good generalization capabilities. The decline in "RL-ground-truth" performance suggests that excessive exploration without sufficient exploitation can be detrimental to long-term performance. The consistent improvement of "Ours (CoNL)" suggests a more robust learning strategy.