\n
## Diagram: Signal Processing Network
### Overview
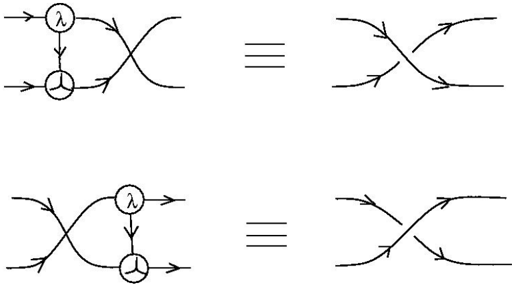
The image presents two diagrams illustrating signal processing networks, likely related to modulation or mixing of signals. Each diagram consists of a network of lines representing signal flow, with circular nodes indicating operations on the signals. The diagrams are paired with equivalent representations using standard signal flow diagrams.
### Components/Axes
The diagrams contain the following components:
* **Signal Input/Output Lines:** Arrows indicate the direction of signal flow.
* **Circular Nodes:**
* A circle with a symbol "λ" inside, likely representing a multiplier or modulator.
* A circle with a "Y" shape inside, likely representing a summing junction.
* **Equal Sign:** "===" indicates equivalence between the network diagram and the standard signal flow diagram.
### Detailed Analysis or Content Details
**Diagram 1 (Top):**
* Two input signals enter the network.
* One signal passes through the modulator (λ).
* Both signals are fed into the summing junction (Y).
* The output of the summing junction is represented by a waveform.
* The equivalent signal flow diagram shows two input signals, one passing through a multiplier, and then both signals being summed.
**Diagram 2 (Bottom):**
* Two input signals enter the network.
* One signal passes through the summing junction (Y).
* The output of the summing junction is fed into the modulator (λ).
* The output of the modulator is represented by a waveform.
* The equivalent signal flow diagram shows two input signals, one being summed, and then the sum being multiplied.
### Key Observations
The diagrams demonstrate the impact of the order of operations (modulation vs. summation) on the resulting signal. The diagrams are visually symmetrical, with the only difference being the placement of the modulator and summing junction.
### Interpretation
These diagrams illustrate fundamental concepts in signal processing, specifically how the order of operations affects the outcome. The first diagram shows a signal being modulated *after* being combined with another signal. The second diagram shows a signal being modulated *before* being combined. This difference can have significant implications in applications like amplitude modulation (AM) or frequency modulation (FM) where the order of mixing and summing determines the characteristics of the modulated signal. The diagrams are not providing numerical data, but rather a conceptual illustration of signal flow and processing. The use of the "===" symbol suggests a mathematical equivalence between the network representation and the standard signal flow diagram, implying that the two representations are interchangeable for analysis purposes.