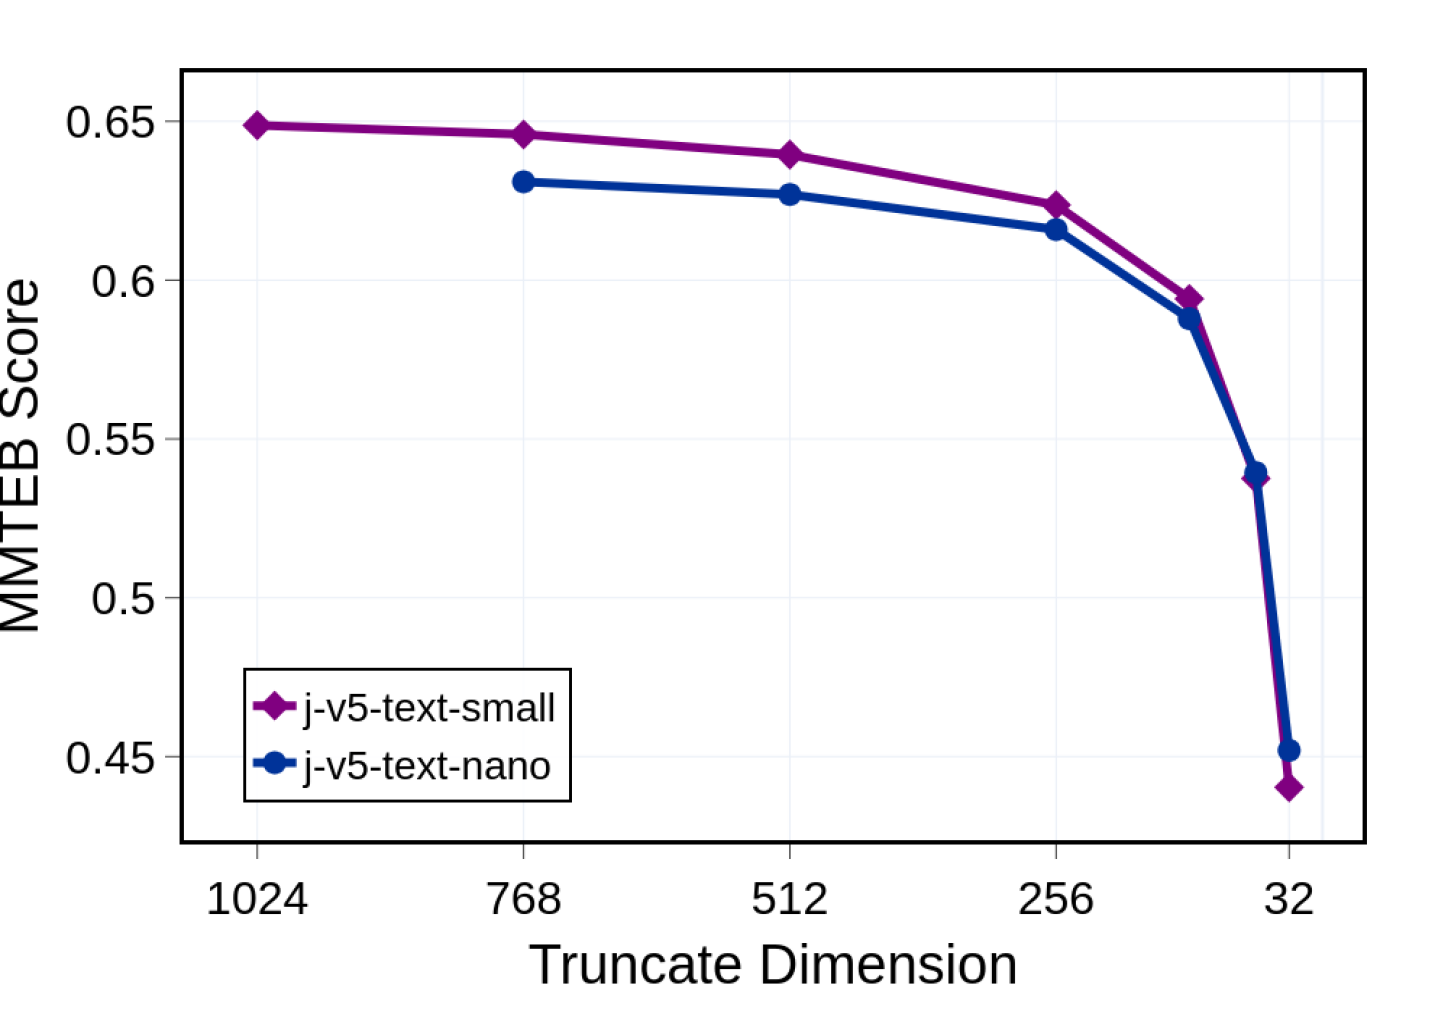
## Line Chart: MTEB Score vs Truncate Dimension
### Overview
The chart compares the performance of two models (`j-v5-text-small` and `j-v5-text-nano`) across varying truncate dimensions (1024, 768, 512, 256, 32) using the MTEB score metric. Both models show a general decline in performance as truncate dimension decreases, with `j-v5-text-nano` experiencing a sharper drop at smaller dimensions.
### Components/Axes
- **X-axis (Truncate Dimension)**: Logarithmically spaced values (1024, 768, 512, 256, 32).
- **Y-axis (MTEB Score)**: Ranges from 0.45 to 0.65, with increments of 0.05.
- **Legend**: Located at the bottom-left corner, associating:
- Purple diamonds (`j-v5-text-small`)
- Blue circles (`j-v5-text-nano`)
### Detailed Analysis
1. **Truncate Dimension = 1024**:
- `j-v5-text-small`: ~0.65 (purple diamond)
- `j-v5-text-nano`: ~0.63 (blue circle)
2. **Truncate Dimension = 768**:
- `j-v5-text-small`: ~0.645 (purple diamond)
- `j-v5-text-nano`: ~0.63 (blue circle)
3. **Truncate Dimension = 512**:
- `j-v5-text-small`: ~0.64 (purple diamond)
- `j-v5-text-nano`: ~0.625 (blue circle)
4. **Truncate Dimension = 256**:
- `j-v5-text-small`: ~0.62 (purple diamond)
- `j-v5-text-nano`: ~0.61 (blue circle)
5. **Truncate Dimension = 32**:
- `j-v5-text-small`: ~0.44 (purple diamond)
- `j-v5-text-nano`: ~0.45 (blue circle)
### Key Observations
- Both models exhibit a downward trend as truncate dimension decreases.
- `j-v5-text-nano` shows a steeper decline, particularly at the smallest dimension (32), where its score drops sharply from ~0.61 (256) to ~0.45 (32).
- `j-v5-text-small` maintains higher scores across all dimensions but also declines significantly at 32 (~0.44).
### Interpretation
The data suggests that smaller truncate dimensions degrade model performance, with the `j-v5-text-nano` model being more sensitive to truncation. This could reflect architectural differences (e.g., resource constraints in the nano model) or training data limitations. The sharp drop at 32 for `j-v5-text-nano` implies a critical threshold where truncation severely impacts its ability to maintain performance. The `j-v5-text-small` model, while more robust, still experiences a notable decline, indicating that even larger models are not immune to truncation effects. These trends highlight the trade-off between model size, truncation, and performance in text-based tasks.