## Line Chart: MMTEB Score
### Overview
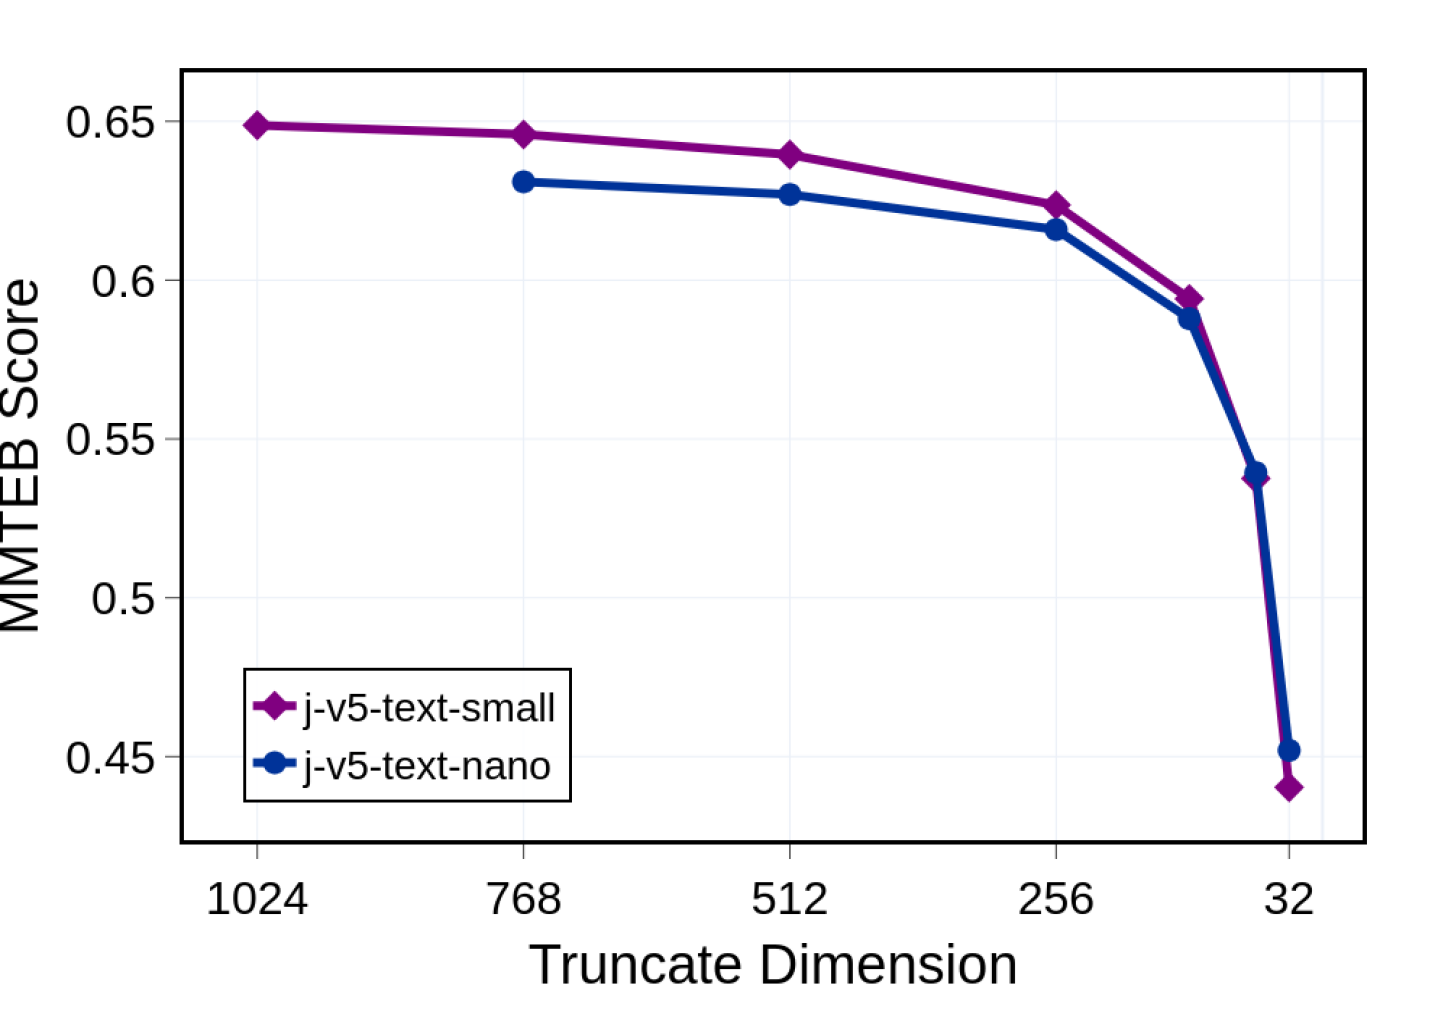
The line chart displays the MMTEB (Multitask Text Embedding Benchmark) scores for two different models, j-v5-text-small and j-v5-text-nano, across various truncate dimensions. The MMTEB score is a measure of how well a model can understand and generate text.
### Components/Axes
- **X-axis (Truncate Dimension)**: Represents the dimension at which the text is truncated. The values range from 1024 to 32.
- **Y-axis (MMTEB Score)**: Represents the MMTEB score, which ranges from 0.45 to 0.65.
- **Legend**: Two lines represent the two models, j-v5-text-small (purple diamonds) and j-v5-text-nano (blue circles).
### Detailed Analysis or ### Content Details
- The j-v5-text-small model shows a relatively stable MMTEB score across the truncate dimensions, ranging from approximately 0.64 to 0.65.
- The j-v5-text-nano model shows a more significant decrease in MMTEB score as the truncate dimension increases. The score starts at around 0.65 and drops to approximately 0.45 by the 32-dimensional truncation.
### Key Observations
- The j-v5-text-nano model consistently performs worse than the j-v5-text-small model across all truncate dimensions.
- There is a clear trend of decreasing performance as the truncate dimension increases.
### Interpretation
The data suggests that the j-v5-text-nano model is less effective at understanding and generating text when the text is truncated to higher dimensions. This could be due to the model's complexity or the amount of information it can process. The j-v5-text-small model, on the other hand, maintains a relatively stable performance across different truncate dimensions, indicating it may be more robust or better suited for handling larger text volumes.