## Bar Chart: Weight Distribution of Data Sources Across Three Blends
### Overview
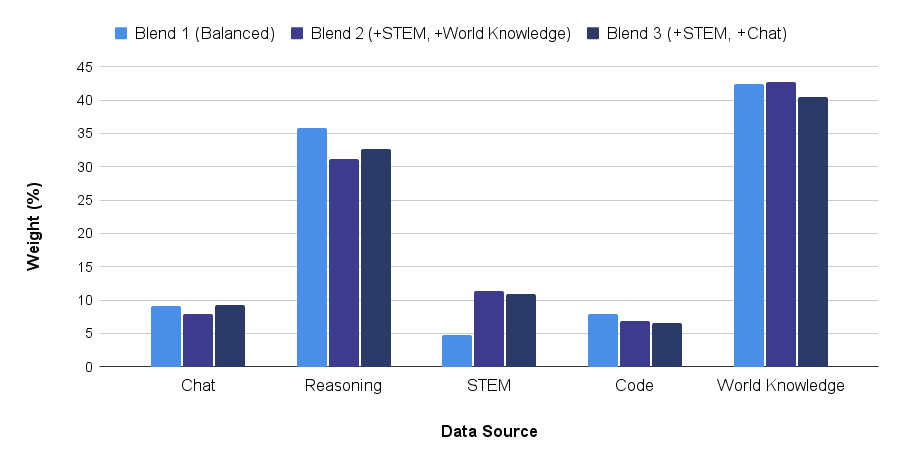
The chart compares the weight distribution (in percentages) of five data sources (Chat, Reasoning, STEM, Code, World Knowledge) across three blends:
- **Blend 1 (Balanced)**
- **Blend 2 (+STEM, +World Knowledge)**
- **Blend 3 (+STEM, +Chat)**
The y-axis represents weight (%), ranging from 0 to 45%, while the x-axis lists data sources. Each blend is represented by a distinct color:
- **Blend 1**: Light blue
- **Blend 2**: Purple
- **Blend 3**: Dark blue
### Components/Axes
- **X-axis (Data Source)**:
Categories: Chat, Reasoning, STEM, Code, World Knowledge.
- **Y-axis (Weight %)**:
Scale: 0 to 45% in 5% increments.
- **Legend**:
Positioned at the top, with color-coded labels for each blend.
### Detailed Analysis
1. **Chat**:
- Blend 1: ~9%
- Blend 2: ~8%
- Blend 3: ~9%
2. **Reasoning**:
- Blend 1: ~35%
- Blend 2: ~31%
- Blend 3: ~32%
3. **STEM**:
- Blend 1: ~5%
- Blend 2: ~11%
- Blend 3: ~10%
4. **Code**:
- Blend 1: ~8%
- Blend 2: ~7%
- Blend 3: ~6%
5. **World Knowledge**:
- Blend 1: ~42%
- Blend 2: ~43%
- Blend 3: ~40%
### Key Observations
- **World Knowledge** dominates all blends, with weights exceeding 40% in Blend 1 and Blend 2.
- **Reasoning** is the second-highest weighted category across all blends.
- **STEM** has the lowest weight in Blend 1 (~5%) but increases in Blend 2 (+STEM) to ~11%.
- **Code** consistently has the lowest weight across all blends (~6–8%).
- **Blend 2 (+STEM, +World Knowledge)** prioritizes STEM and World Knowledge, while **Blend 3 (+STEM, +Chat)** shows reduced emphasis on Chat (~6–9%) compared to Blend 1.
### Interpretation
The chart highlights that **World Knowledge** is the most critical data source across all blends, suggesting its foundational role in the system. **Blend 2** explicitly emphasizes STEM and World Knowledge, aligning with its label, while **Blend 3** includes Chat but assigns it minimal weight (~6–9%), indicating a weaker reliance on conversational data. **Blend 1 (Balanced)** distributes weights more evenly but still prioritizes World Knowledge (~42%), suggesting a baseline preference for general knowledge over specialized domains.
Notably, **STEM** and **Code** receive disproportionately low weights in Blend 1, despite their inclusion in Blend 2 and 3. This implies that the "balanced" approach may undervalue technical domains unless explicitly augmented (as in Blend 2 and 3). The slight variations between blends (e.g., Blend 2’s higher STEM weight) reflect tailored adjustments to domain-specific priorities.