\n
## Bar Chart: Data Source Weighting for Different Blends
### Overview
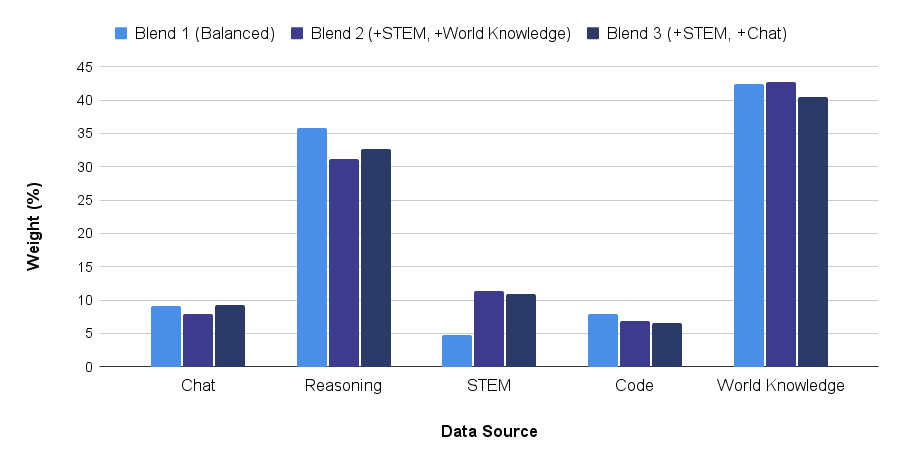
This bar chart compares the weighting of different data sources (Chat, Reasoning, STEM, Code, and World Knowledge) across three different blends: Blend 1 (Balanced), Blend 2 (+STEM, +World Knowledge), and Blend 3 (+STEM, +Chat). The weighting is expressed as a percentage.
### Components/Axes
* **X-axis:** "Data Source" with categories: Chat, Reasoning, STEM, Code, World Knowledge.
* **Y-axis:** "Weight (%)" with a scale ranging from 0 to 45, incrementing by 5.
* **Legend:** Located at the top-left corner, identifying the three blends:
* Blend 1 (Balanced) - Light Blue
* Blend 2 (+STEM, +World Knowledge) - Medium Blue
* Blend 3 (+STEM, +Chat) - Dark Blue
### Detailed Analysis
The chart consists of five groups of three bars, one for each blend, corresponding to each data source.
**Chat:**
* Blend 1 (Light Blue): Approximately 10%
* Blend 2 (Medium Blue): Approximately 9%
* Blend 3 (Dark Blue): Approximately 10%
**Reasoning:**
* Blend 1 (Light Blue): Approximately 35%
* Blend 2 (Medium Blue): Approximately 33%
* Blend 3 (Dark Blue): Approximately 32%
**STEM:**
* Blend 1 (Light Blue): Approximately 10%
* Blend 2 (Medium Blue): Approximately 12%
* Blend 3 (Dark Blue): Approximately 8%
**Code:**
* Blend 1 (Light Blue): Approximately 8%
* Blend 2 (Medium Blue): Approximately 7%
* Blend 3 (Dark Blue): Approximately 7%
**World Knowledge:**
* Blend 1 (Light Blue): Approximately 42%
* Blend 2 (Medium Blue): Approximately 42%
* Blend 3 (Dark Blue): Approximately 41%
### Key Observations
* Blend 1 (Balanced) gives the highest weighting to World Knowledge (approximately 42%) and Reasoning (approximately 35%).
* Blend 2 (+STEM, +World Knowledge) shows increased weighting for STEM (approximately 12%) compared to Blend 1, while maintaining a similar weighting for World Knowledge (approximately 42%).
* Blend 3 (+STEM, +Chat) shows a slight increase in weighting for Chat (approximately 10%) compared to Blend 1, and a slight decrease in weighting for STEM (approximately 8%).
* The weighting for Code is consistently low across all three blends (around 7-8%).
* The weighting for Chat is relatively stable across all blends, hovering around 9-10%.
### Interpretation
The data suggests that the three blends represent different priorities in data source utilization. Blend 1 aims for a balanced approach, heavily relying on World Knowledge and Reasoning. Blend 2 prioritizes STEM and World Knowledge, potentially for tasks requiring scientific or technical expertise. Blend 3 emphasizes STEM and Chat, possibly for applications involving conversational AI with a technical focus. The consistently low weighting of Code across all blends indicates that code generation or analysis is not a primary focus for these models. The small differences in weighting between the blends suggest that the adjustments made to each blend have a moderate impact on the overall data source distribution. The chart provides a clear visualization of how different blends prioritize different types of knowledge and reasoning capabilities.