\n
## Chart: Accuracy vs. Thinking Compute
### Overview
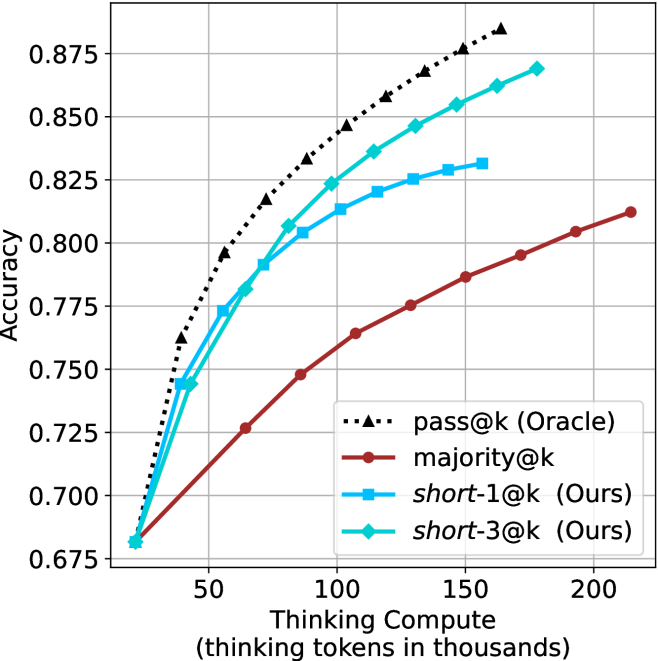
The image presents a line chart illustrating the relationship between "Thinking Compute" (measured in thousands of tokens) and "Accuracy" for four different methods: pass@k (Oracle), majority@k, short-1@k (Ours), and short-3@k (Ours). The chart demonstrates how accuracy improves with increased computational effort (thinking tokens) for each method.
### Components/Axes
* **X-axis:** "Thinking Compute (thinking tokens in thousands)". Scale ranges from approximately 0 to 200, with markers at 0, 50, 100, 150, and 200.
* **Y-axis:** "Accuracy". Scale ranges from approximately 0.675 to 0.875, with markers at 0.675, 0.725, 0.775, 0.825, and 0.875.
* **Legend:** Located in the bottom-right corner. Contains the following labels and corresponding line styles/colors:
* "pass@k (Oracle)" - Black dashed line with triangle markers.
* "majority@k" - Brown solid line with circle markers.
* "short-1@k (Ours)" - Red solid line with circle markers.
* "short-3@k (Ours)" - Blue solid line with triangle markers.
### Detailed Analysis
* **pass@k (Oracle):** The black dashed line starts at approximately (0, 0.72) and exhibits a steep upward slope, reaching approximately (200, 0.87). The line appears to plateau around 150 thinking tokens.
* **majority@k:** The brown solid line begins at approximately (0, 0.68) and shows a gradual upward trend, reaching approximately (200, 0.81). The slope is less steep than "pass@k (Oracle)".
* **short-1@k (Ours):** The red solid line starts at approximately (0, 0.68) and demonstrates a moderate upward slope, reaching approximately (200, 0.81). It is initially below "majority@k" but converges with it at higher compute values.
* **short-3@k (Ours):** The blue solid line begins at approximately (0, 0.74) and exhibits a steep upward slope, reaching approximately (200, 0.86). It consistently outperforms "short-1@k (Ours)" and approaches the performance of "pass@k (Oracle)".
Specific Data Points (approximate):
| Thinking Compute (thousands) | pass@k (Oracle) | majority@k | short-1@k (Ours) | short-3@k (Ours) |
|---|---|---|---|---|
| 0 | 0.72 | 0.68 | 0.68 | 0.74 |
| 50 | 0.80 | 0.75 | 0.76 | 0.82 |
| 100 | 0.84 | 0.79 | 0.79 | 0.84 |
| 150 | 0.86 | 0.80 | 0.80 | 0.85 |
| 200 | 0.87 | 0.81 | 0.81 | 0.86 |
### Key Observations
* "pass@k (Oracle)" consistently achieves the highest accuracy across all compute levels.
* "short-3@k (Ours)" outperforms "short-1@k (Ours)" significantly, demonstrating the benefit of increasing the number of considered options.
* The accuracy gains diminish as "Thinking Compute" increases, suggesting a point of diminishing returns.
* "majority@k" shows the slowest rate of improvement with increasing compute.
### Interpretation
The chart compares the performance of different methods for a task that requires "thinking" or reasoning, as measured by the number of tokens processed. The "Oracle" method, which presumably has access to perfect information, sets the upper bound on achievable accuracy. The "Ours" methods (short-1@k and short-3@k) represent approaches developed by the authors, and their performance relative to the "Oracle" and "majority@k" methods indicates their effectiveness.
The diminishing returns observed at higher compute levels suggest that there's a limit to how much accuracy can be gained by simply increasing the computational effort. This could be due to inherent limitations in the methods themselves or the nature of the task. The difference between "short-1@k" and "short-3@k" highlights the importance of considering multiple options or hypotheses during the reasoning process. The fact that "short-3@k" approaches the performance of the "Oracle" method suggests that it's a promising approach for achieving high accuracy in this type of task. The "majority@k" method appears to be the least effective, indicating that simply aggregating the results of multiple runs doesn't necessarily lead to improved performance.