## Line Graph: Accuracy vs. Thinking Compute
### Overview
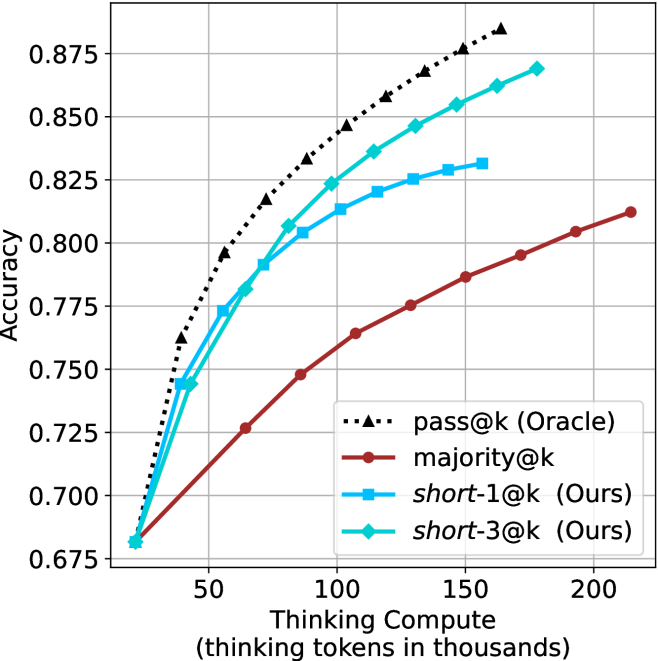
The image is a line graph comparing the performance (Accuracy) of four different methods or models as a function of computational effort (Thinking Compute). The graph demonstrates how accuracy improves with increased compute for each method, with one method consistently outperforming the others.
### Components/Axes
* **Chart Type:** Line graph with markers.
* **X-Axis:**
* **Label:** `Thinking Compute (thinking tokens in thousands)`
* **Scale:** Linear, ranging from approximately 25 to 225 (thousands of tokens).
* **Major Tick Marks:** 50, 100, 150, 200.
* **Y-Axis:**
* **Label:** `Accuracy`
* **Scale:** Linear, ranging from 0.675 to 0.875.
* **Major Tick Marks:** 0.675, 0.700, 0.725, 0.750, 0.775, 0.800, 0.825, 0.850, 0.875.
* **Legend:** Located in the bottom-right quadrant of the chart area. It contains four entries:
1. `pass@k (Oracle)`: Black dotted line with upward-pointing triangle markers.
2. `majority@k`: Solid dark red line with circle markers.
3. `short-1@k (Ours)`: Solid cyan line with square markers.
4. `short-3@k (Ours)`: Solid cyan line with diamond markers.
* **Grid:** A light gray grid is present, aligning with the major tick marks on both axes.
### Detailed Analysis
**Trend Verification & Data Points (Approximate):**
1. **pass@k (Oracle) [Black dotted line, triangles]:**
* **Trend:** Steepest upward slope, showing the highest accuracy at all compute levels. The curve is concave, indicating diminishing returns as compute increases.
* **Data Points:**
* ~25k tokens: 0.680
* ~50k tokens: 0.765
* ~75k tokens: 0.805
* ~100k tokens: 0.845
* ~125k tokens: 0.860
* ~150k tokens: 0.875
* ~175k tokens: 0.885 (estimated, point is above the 0.875 grid line)
2. **short-3@k (Ours) [Cyan line, diamonds]:**
* **Trend:** Second steepest slope, closely following but consistently below the Oracle line. Also shows a concave curve.
* **Data Points:**
* ~25k tokens: 0.680
* ~50k tokens: 0.745
* ~75k tokens: 0.790
* ~100k tokens: 0.825
* ~125k tokens: 0.840
* ~150k tokens: 0.855
* ~175k tokens: 0.865
* ~200k tokens: 0.870
3. **short-1@k (Ours) [Cyan line, squares]:**
* **Trend:** Slope is less steep than short-3@k. It begins to plateau noticeably after ~100k tokens.
* **Data Points:**
* ~25k tokens: 0.680
* ~50k tokens: 0.745 (appears identical to short-3@k at this point)
* ~75k tokens: 0.780
* ~100k tokens: 0.805
* ~125k tokens: 0.815
* ~150k tokens: 0.825
* ~160k tokens: 0.830 (final data point for this series)
4. **majority@k [Red line, circles]:**
* **Trend:** Shallowest slope, showing the lowest accuracy at all compute levels. The curve is nearly linear, suggesting less pronounced diminishing returns within this range.
* **Data Points:**
* ~25k tokens: 0.680
* ~50k tokens: 0.725
* ~75k tokens: 0.750
* ~100k tokens: 0.765
* ~125k tokens: 0.775
* ~150k tokens: 0.785
* ~175k tokens: 0.795
* ~200k tokens: 0.805
* ~225k tokens: 0.815
### Key Observations
1. **Common Starting Point:** All four methods begin at approximately the same accuracy (~0.680) at the lowest compute level (~25k tokens).
2. **Performance Hierarchy:** A clear and consistent performance hierarchy is established very early (by ~50k tokens) and maintained throughout: `pass@k (Oracle)` > `short-3@k (Ours)` > `short-1@k (Ours)` > `majority@k`.
3. **Diminishing Returns:** All curves show diminishing returns (concave shape), but the degree varies. The `pass@k` and `short-3@k` curves continue to rise significantly even at high compute, while `short-1@k` plateaus more sharply.
4. **"Ours" Methods:** The two methods labeled "(Ours)" occupy the middle ground. `short-3@k` demonstrates a clear advantage over `short-1@k`, especially at higher compute levels (>100k tokens), suggesting that the "3" variant scales better.
5. **Oracle as Upper Bound:** The `pass@k (Oracle)` line acts as a performance ceiling or upper bound for the other methods.
### Interpretation
This chart likely comes from a research paper in machine learning or natural language processing, comparing different strategies for improving model accuracy by allocating more "thinking" or reasoning compute (measured in tokens).
* **What the data suggests:** The data demonstrates that investing more computational resources (thinking tokens) improves accuracy for all tested methods. However, the efficiency of this investment varies dramatically. The `pass@k (Oracle)` method represents an idealized or best-case scenario (possibly using ground-truth information or an exhaustive search), setting a theoretical maximum. The proposed methods (`short-1@k` and `short-3@k`) are being evaluated against this ceiling and a baseline (`majority@k`).
* **Relationship between elements:** The graph's core message is about **scaling efficiency**. It answers: "For a given budget of thinking tokens, which method yields the highest accuracy?" The authors' method `short-3@k` is shown to be more efficient than `short-1@k` and the `majority@k` baseline, as it achieves higher accuracy for the same compute, or the same accuracy for less compute.
* **Notable implications:** The plateau of `short-1@k` suggests it may hit a fundamental limit in its ability to leverage additional compute. In contrast, `short-3@k`'s continued growth implies its design is better suited for scaling. The significant gap between all methods and the Oracle line indicates there is still substantial room for improvement in algorithmic efficiency for this task. The chart argues for the effectiveness of the authors' `short-3@k` approach as a better trade-off between computational cost and performance.