## Line Chart: Accuracy vs. Thinking Compute (Thinking Tokens in Thousands)
### Overview
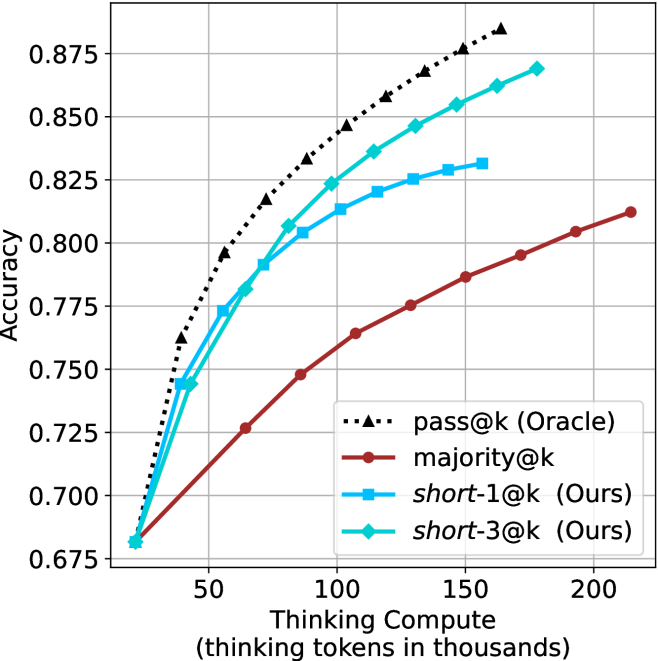
The chart compares the accuracy of four methods across varying levels of thinking compute (measured in thousands of tokens). The y-axis represents accuracy (0.75–0.875), and the x-axis represents thinking compute (50–200k tokens). Four data series are plotted with distinct markers and colors, showing how accuracy improves with increased compute.
### Components/Axes
- **X-axis**: "Thinking Compute (thinking tokens in thousands)" (50–200k tokens, increments of 50k).
- **Y-axis**: "Accuracy" (0.75–0.875, increments of 0.025).
- **Legend**: Located in the top-right corner, with four entries:
- **pass@k (Oracle)**: Black triangles (▲).
- **majority@k**: Red squares (■).
- **short-1@k (Ours)**: Blue circles (●).
- **short-3@k (Ours)**: Green diamonds (◇).
### Detailed Analysis
1. **pass@k (Oracle)**:
- Starts at ~0.76 accuracy at 50k tokens.
- Increases steeply to ~0.875 at 200k tokens.
- Follows a dashed black line with triangular markers.
2. **majority@k**:
- Starts at ~0.76 accuracy at 50k tokens.
- Rises gradually to ~0.81 at 200k tokens.
- Follows a solid red line with square markers.
3. **short-1@k (Ours)**:
- Starts at ~0.76 accuracy at 50k tokens.
- Increases to ~0.825 at 200k tokens.
- Follows a solid blue line with circular markers.
4. **short-3@k (Ours)**:
- Starts at ~0.76 accuracy at 50k tokens.
- Rises to ~0.85 at 200k tokens.
- Follows a solid green line with diamond markers.
### Key Observations
- All methods show an upward trend in accuracy with increased compute.
- **pass@k (Oracle)** achieves the highest accuracy (~0.875) and the steepest slope, indicating the strongest scaling with compute.
- **short-3@k (Ours)** outperforms **short-1@k (Ours)** and **majority@k**, suggesting it is more efficient or effective.
- **majority@k** has the flattest slope, showing minimal improvement with added compute.
- All lines converge near 0.76 accuracy at 50k tokens, indicating similar baseline performance.
### Interpretation
The chart demonstrates that **pass@k (Oracle)** is the most effective method, achieving near-optimal accuracy with increased compute. The "Ours" methods (**short-1@k** and **short-3@k**) outperform **majority@k** but fall short of the Oracle, suggesting room for improvement. The steeper slope of **pass@k** implies it leverages compute more efficiently. **short-3@k** may represent a refined version of **short-1@k**, as it achieves higher accuracy with the same compute. The convergence at 50k tokens highlights that all methods start from a similar baseline, but their divergence at higher compute levels reveals significant differences in scalability.