## Diagram: Context Length Threshold Visualization
### Overview
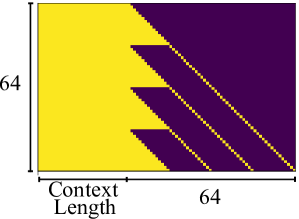
The image depicts a rectangular diagram divided into two primary regions: a large yellow area on the left and a smaller purple triangular region on the right. Three diagonal yellow dashed lines separate these regions, creating a stepped pattern. The vertical axis is labeled "64" on the left, and the horizontal axis is labeled "Context Length" with "64" at the far right.
### Components/Axes
- **Vertical Axis**: Labeled "64" (no explicit unit or variable name).
- **Horizontal Axis**: Labeled "Context Length," with a scale ending at "64."
- **Regions**:
- **Yellow Region**: Occupies the left 75% of the diagram, bounded by the left edge, bottom edge, and the first diagonal line.
- **Purple Region**: A right-angled triangle occupying the upper-right corner, bounded by the top edge, right edge, and the third diagonal line.
- **Diagonal Lines**: Three evenly spaced yellow dashed lines originating from the bottom-right corner, ascending diagonally toward the top-left. These lines create a stepped boundary between the yellow and purple regions.
### Detailed Analysis
- **Yellow Region**:
- Covers the majority of the diagram (≈75% of the area).
- Bounded by the left edge (x=0), bottom edge (y=0), and the first diagonal line (slope ≈ -1, intercept ≈ 64).
- The second and third diagonal lines further subdivide the yellow region into smaller trapezoidal sections.
- **Purple Region**:
- A right triangle with vertices at (64, 0), (64, 64), and (0, 64).
- Bounded by the third diagonal line (slope ≈ -1, intercept ≈ 64), the top edge (y=64), and the right edge (x=64).
- **Diagonal Lines**:
- All lines are yellow, dashed, and have a consistent slope of -1.
- The first line intersects the bottom edge at (64, 0) and the left edge at (0, 64).
- The second and third lines are parallel to the first, spaced at intervals of ≈21.3 units along the x-axis (calculated as 64/3).
### Key Observations
1. **Threshold Behavior**: The diagonal lines suggest a stepwise reduction in the "Context Length" threshold, with each line representing a discrete boundary.
2. **Area Proportions**: The yellow region dominates, while the purple region occupies ≈25% of the total area.
3. **Symmetry**: The diagonal lines form a 45° angle with both axes, indicating a direct proportionality between the x- and y-axes.
### Interpretation
This diagram likely represents a system where "Context Length" (horizontal axis) interacts with an unspecified vertical parameter (fixed at 64). The diagonal lines may indicate critical thresholds where the system transitions from a "valid" (yellow) to an "invalid" (purple) state. For example:
- **Yellow Region**: Valid operational range where context length ≤ 64 and meets unspecified criteria.
- **Purple Region**: Exceeds thresholds, potentially triggering errors or limitations.
- **Diagonal Lines**: Could represent incremental checkpoints (e.g., 64, 42.7, 21.3) where the system evaluates context length against a constraint.
The fixed vertical axis value (64) suggests a maximum capacity or upper bound for the system, while the horizontal axis implies scalability up to 64 units of context length. The stepped boundaries might reflect discrete processing stages or resource allocation limits.