# Technical Document Extraction: Box Plot Analysis
## **Chart Type**
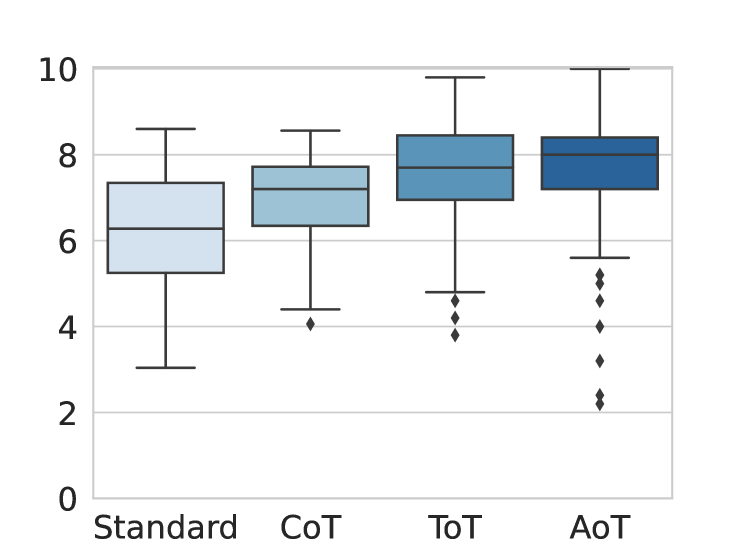
- Box plot (box-and-whisker plot) comparing four categorical groups.
---
## **Axis Labels and Markers**
- **X-axis (Categories):**
- Labels: `Standard`, `CoT`, `ToT`, `AoT`
- No numerical axis markers (categorical).
- **Y-axis (Values):**
- Title: `Value`
- Range: `0` to `10` (linear scale, increments of `2`).
---
## **Legend and Color Coding**
- **Legend:** Not explicitly labeled, but colors are distinct for each category:
- `Standard`: Light blue (`#ADD8E6`)
- `CoT`: Medium blue (`#87CEEB`)
- `ToT`: Dark blue (`#4682B4`)
- `AoT`: Navy blue (`#000080`)
- **Color Consistency:**
- Boxes and median lines match category colors.
- Outliers (diamonds) are black (`#000000`).
---
## **Data Points and Trends**
### **Key Observations:**
1. **Median Values (Central Line in Boxes):**
- `Standard`: ~6
- `CoT`: ~7
- `ToT`: ~7.5
- `AoT`: ~8
2. **Interquartile Range (IQR):**
- `Standard`: ~5–7 (IQR ≈ 2)
- `CoT`: ~6–8 (IQR ≈ 2)
- `ToT`: ~7–9 (IQR ≈ 2)
- `AoT`: ~7–9 (IQR ≈ 2)
3. **Whisker Range (Excluding Outliers):**
- `Standard`: ~3–9
- `CoT`: ~4–9
- `ToT`: ~5–10
- `AoT`: ~5–10
4. **Outliers (Diamond Markers):**
- `Standard`: 1 outlier at ~4
- `CoT`: 1 outlier at ~4
- `ToT`: 5 outliers (~4, 4.5, 5, 5.5, 6)
- `AoT`: 6 outliers (~4, 4.5, 5, 5.5, 6, 6.5)
5. **Extreme Values:**
- Maximum whisker values:
- `Standard`: 9
- `CoT`: 9
- `ToT`: 10
- `AoT`: 10
- Minimum whisker values:
- `Standard`: 3
- `CoT`: 4
- `ToT`: 5
- `AoT`: 5
---
## **Components of the Box Plot**
1. **Box:**
- Represents the interquartile range (IQR).
- Top edge: Third quartile (Q3).
- Bottom edge: First quartile (Q1).
- Median line: Horizontal line inside the box.
2. **Whiskers:**
- Extend from Q1 to the minimum non-outlier value.
- Extend from Q3 to the maximum non-outlier value.
3. **Outliers:**
- Marked as black diamonds (`•`).
- Defined as values outside 1.5×IQR from Q1/Q3.
---
## **Summary of Trends**
- **Increasing Central Tendency:**
Median values increase progressively from `Standard` to `AoT`.
- **Similar IQRs:**
All categories exhibit comparable variability (IQR ≈ 2).
- **Outlier Distribution:**
`AoT` has the highest number of outliers, suggesting greater data dispersion.
- **Extreme Values:**
`ToT` and `AoT` reach the maximum y-axis value (10), while `Standard` has the lowest minimum (3).
---
## **Data Table Reconstruction (Hypothetical)**
| Category | Median | Q1 | Q3 | Min (Whisker) | Max (Whisker) | Outliers (Count) |
|----------|--------|----|----|---------------|---------------|------------------|
| Standard | 6 | 5 | 7 | 3 | 9 | 1 |
| CoT | 7 | 6 | 8 | 4 | 9 | 1 |
| ToT | 7.5 | 7 | 9 | 5 | 10 | 5 |
| AoT | 8 | 7 | 9 | 5 | 10 | 6 |
---
## **Conclusion**
The box plot illustrates a clear trend of increasing central tendency (median) from `Standard` to `AoT`, with `AoT` showing the highest median and most outliers. All categories share similar variability (IQR), but `AoT` and `ToT` exhibit broader ranges and higher extreme values. Outliers are more frequent in `AoT`, indicating potential anomalies or variability in that group.