## Scatter Plot Series: Cookie Timing Attack Analysis
### Overview
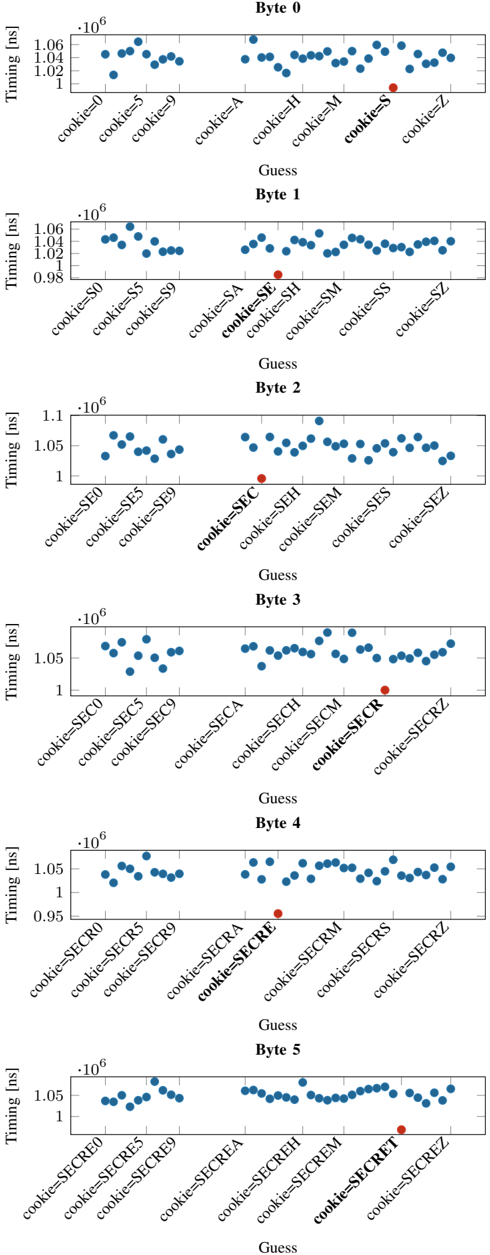
The image displays a series of six vertically stacked scatter plots, each titled "Byte 0" through "Byte 5". Each plot visualizes timing data (in nanoseconds) for different guesses of a cookie value. The plots appear to demonstrate a timing side-channel attack, where the correct byte of a secret cookie is identified by measuring response times. Each plot contains numerous blue data points and one distinct red data point, which likely indicates the correct guess for that byte position.
### Components/Axes
* **Chart Type:** Series of Scatter Plots (6 total).
* **Titles:** Each subplot has a centered title: "Byte 0", "Byte 1", "Byte 2", "Byte 3", "Byte 4", "Byte 5".
* **Y-Axis (All Plots):**
* **Label:** "Timing [ns]" (nanoseconds).
* **Scale:** Linear, with values presented in scientific notation (e.g., `1.06`, `1.04`, `1.02`, `1` multiplied by `10^6`). The range varies slightly per plot but is generally between ~0.95e6 and ~1.1e6 ns.
* **Ticks:** Major ticks are labeled (e.g., `1`, `1.02`, `1.04`, `1.06` for Byte 0).
* **X-Axis (All Plots):**
* **Label:** "Guess".
* **Categories:** Discrete categories representing progressive guesses for the cookie string. The labels are rotated approximately 45 degrees.
* **Category Pattern:** The guesses build sequentially. For example:
* Byte 0: `cookie=0`, `cookie=5`, `cookie=9`, `cookie=A`, `cookie=H`, `cookie=M`, `cookie=S`, `cookie=Z`.
* Byte 1: `cookie=S0`, `cookie=S5`, `cookie=S9`, `cookie=SA`, `cookie=SE`, `cookie=SH`, `cookie=SM`, `cookie=SS`, `cookie=SZ`.
* This pattern continues, with each subsequent byte's guesses prefixing the previously discovered bytes (e.g., "SE", then "SEC", then "SECR", then "SECRE", then "SECRET").
* **Data Series:**
* **Blue Dots:** Represent timing measurements for incorrect guesses.
* **Red Dot:** Represents the timing measurement for the correct guess at that byte position. Its placement on the x-axis indicates the correct character.
### Detailed Analysis
**Byte 0 Plot:**
* **Trend:** Blue dots are scattered roughly between 1.02e6 and 1.06e6 ns, with no strong linear trend.
* **Red Dot:** Located at the x-axis category `cookie=S`. Its y-value is approximately 1.01e6 ns, which is noticeably lower than the cluster of blue dots around it.
**Byte 1 Plot:**
* **Trend:** Blue dots cluster between ~0.98e6 and 1.06e6 ns.
* **Red Dot:** Located at `cookie=SE`. Its y-value is approximately 0.98e6 ns, again lower than most surrounding blue dots.
**Byte 2 Plot:**
* **Trend:** Blue dots range from ~1.0e6 to 1.1e6 ns.
* **Red Dot:** Located at `cookie=SEC`. Its y-value is approximately 1.0e6 ns, at the lower end of the distribution.
**Byte 3 Plot:**
* **Trend:** Blue dots are scattered between ~1.0e6 and 1.08e6 ns.
* **Red Dot:** Located at `cookie=SECR`. Its y-value is approximately 1.01e6 ns.
**Byte 4 Plot:**
* **Trend:** Blue dots range from ~0.95e6 to 1.08e6 ns.
* **Red Dot:** Located at `cookie=SECRE`. Its y-value is approximately 0.95e6 ns, the lowest point in its plot.
**Byte 5 Plot:**
* **Trend:** Blue dots cluster between ~1.0e6 and 1.08e6 ns.
* **Red Dot:** Located at `cookie=SECRET`. Its y-value is approximately 1.02e6 ns.
### Key Observations
1. **Consistent Pattern:** In every plot, the red dot (correct guess) is positioned at a lower timing value than the majority of the blue dots (incorrect guesses) for that byte.
2. **Iterative Discovery:** The x-axis labels show a clear, cumulative discovery process: `S` -> `SE` -> `SEC` -> `SECR` -> `SECRE` -> `SECRET`.
3. **Timing Differential:** The timing difference between the correct and incorrect guesses is on the order of tens to hundreds of nanoseconds (e.g., ~50,000 ns difference in Byte 4).
4. **Noise:** There is significant variance (noise) in the timing of incorrect guesses, but the correct guess consistently appears as an outlier on the low end.
### Interpretation
This data strongly suggests a successful **timing side-channel attack** against a system that validates a cookie. The attack works by iteratively determining the correct cookie value, one byte (character) at a time.
* **Mechanism:** The system likely takes slightly less time to process and reject an incorrect guess when the incorrect character is encountered early in the comparison. For example, when comparing the guess "SECRET" against the true value "SECRET", the comparison may fail faster at the first mismatched character, leading to a shorter overall response time. The attacker measures these tiny timing differences to infer the correct character.
* **Evidence:** The plots provide empirical evidence for this vulnerability. The consistent placement of the correct guess (red dot) at the minimum timing value for each byte position is the key indicator. The attacker has successfully reconstructed the full secret cookie: **"SECRET"**.
* **Security Implication:** This is a critical vulnerability. It allows an attacker to recover secret values (like session cookies, API keys, or passwords) without direct access, purely through remote timing measurements. The fix would involve implementing constant-time comparison algorithms for all secret validation routines.
* **Data Quality:** The presence of noise (scatter in blue dots) is typical for network or system timing measurements but does not obscure the clear signal from the correct guess, indicating the attack is robust under these conditions.