## Bar Chart: Execution Time Comparison for Different Datasets and Thread Counts
### Overview
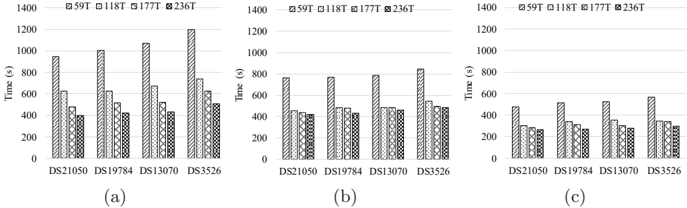
The image presents three bar charts, labeled (a), (b), and (c), comparing the execution time (in seconds) for different datasets (DS21050, DS19784, DS13070, DS3526) using varying thread counts (59T, 118T, 177T, 236T). Each chart represents a different experimental setup or configuration.
### Components/Axes
* **Y-axis:** Time (s), ranging from 0 to 1400 in increments of 200.
* **X-axis:** Datasets: DS21050, DS19784, DS13070, DS3526.
* **Legend:** Located at the top of each chart.
* 59T: Solid light gray bars
* 118T: White bars with horizontal lines
* 177T: Light gray bars with vertical lines
* 236T: White bars with a checkerboard pattern
### Detailed Analysis
**Chart (a):**
* **DS21050:**
* 59T: Approximately 950 s
* 118T: Approximately 650 s
* 177T: Approximately 480 s
* 236T: Approximately 400 s
* **DS19784:**
* 59T: Approximately 1000 s
* 118T: Approximately 620 s
* 177T: Approximately 450 s
* 236T: Approximately 420 s
* **DS13070:**
* 59T: Approximately 1080 s
* 118T: Approximately 680 s
* 177T: Approximately 500 s
* 236T: Approximately 450 s
* **DS3526:**
* 59T: Approximately 1200 s
* 118T: Approximately 750 s
* 177T: Approximately 650 s
* 236T: Approximately 620 s
**Chart (b):**
* **DS21050:**
* 59T: Approximately 750 s
* 118T: Approximately 450 s
* 177T: Approximately 420 s
* 236T: Approximately 400 s
* **DS19784:**
* 59T: Approximately 780 s
* 118T: Approximately 480 s
* 177T: Approximately 450 s
* 236T: Approximately 420 s
* **DS13070:**
* 59T: Approximately 800 s
* 118T: Approximately 500 s
* 177T: Approximately 480 s
* 236T: Approximately 450 s
* **DS3526:**
* 59T: Approximately 1300 s
* 118T: Approximately 800 s
* 177T: Approximately 750 s
* 236T: Approximately 720 s
**Chart (c):**
* **DS21050:**
* 59T: Approximately 480 s
* 118T: Approximately 320 s
* 177T: Approximately 280 s
* 236T: Approximately 260 s
* **DS19784:**
* 59T: Approximately 520 s
* 118T: Approximately 350 s
* 177T: Approximately 300 s
* 236T: Approximately 280 s
* **DS13070:**
* 59T: Approximately 500 s
* 118T: Approximately 380 s
* 177T: Approximately 320 s
* 236T: Approximately 300 s
* **DS3526:**
* 59T: Approximately 550 s
* 118T: Approximately 380 s
* 177T: Approximately 350 s
* 236T: Approximately 330 s
### Key Observations
* In all three charts, increasing the thread count generally reduces the execution time for each dataset.
* Dataset DS3526 consistently exhibits the highest execution times across all thread counts and charts.
* The performance improvement from increasing thread count diminishes as the thread count increases, suggesting diminishing returns.
* The relative performance of the datasets varies across the three charts, indicating that the experimental setup significantly impacts performance.
### Interpretation
The charts demonstrate the impact of thread count on the execution time of different datasets. The general trend shows that increasing the thread count reduces execution time, likely due to increased parallelism. However, the diminishing returns suggest that there is an optimal thread count beyond which further increases provide minimal benefit. The varying performance of the datasets across the three charts indicates that the experimental setup (represented by charts a, b, and c) plays a crucial role in determining the overall performance. The consistently high execution time for DS3526 suggests that this dataset is inherently more complex or resource-intensive than the others. Further investigation is needed to understand the specific differences between the experimental setups represented by charts (a), (b), and (c) and the characteristics of the datasets that contribute to their varying performance.