## Bar Chart: Time vs. Dataset
### Overview
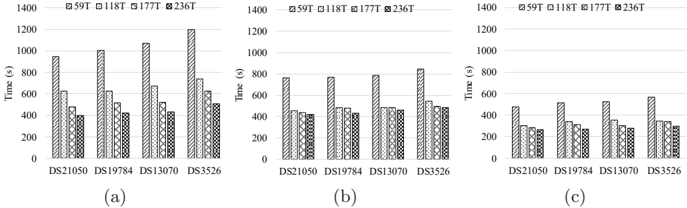
The image presents three separate bar charts (labeled (a), (b), and (c)) comparing the "Time (s)" taken for four different datasets: DS21050, DS19784, DS13070, and DS3526, using four different algorithms: 59T, 118T, 177T, and 236T. Each chart displays the time taken for each algorithm on each dataset. The charts use a grouped bar format, with each group representing a dataset and each bar within the group representing an algorithm.
### Components/Axes
* **X-axis:** Datasets - DS21050, DS19784, DS13070, DS3526
* **Y-axis:** Time (s) - Scale ranges from 0 to 1400 seconds.
* **Legend:**
* 59T (represented by a white bar with diagonal stripes)
* 118T (represented by a light gray bar with diagonal stripes)
* 177T (represented by a dark gray bar with diagonal stripes)
* 236T (represented by a black bar with diagonal stripes)
### Detailed Analysis or Content Details
**Chart (a):**
* **DS21050:**
* 59T: Approximately 1050 s
* 118T: Approximately 600 s
* 177T: Approximately 450 s
* 236T: Approximately 500 s
* **DS19784:**
* 59T: Approximately 1100 s
* 118T: Approximately 500 s
* 177T: Approximately 400 s
* 236T: Approximately 450 s
* **DS13070:**
* 59T: Approximately 400 s
* 118T: Approximately 300 s
* 177T: Approximately 250 s
* 236T: Approximately 300 s
* **DS3526:**
* 59T: Approximately 900 s
* 118T: Approximately 500 s
* 177T: Approximately 400 s
* 236T: Approximately 1250 s
**Chart (b):**
* **DS21050:**
* 59T: Approximately 800 s
* 118T: Approximately 450 s
* 177T: Approximately 400 s
* 236T: Approximately 450 s
* **DS19784:**
* 59T: Approximately 450 s
* 118T: Approximately 400 s
* 177T: Approximately 400 s
* 236T: Approximately 450 s
* **DS13070:**
* 59T: Approximately 450 s
* 118T: Approximately 300 s
* 177T: Approximately 300 s
* 236T: Approximately 400 s
* **DS3526:**
* 59T: Approximately 850 s
* 118T: Approximately 450 s
* 177T: Approximately 400 s
* 236T: Approximately 450 s
**Chart (c):**
* **DS21050:**
* 59T: Approximately 300 s
* 118T: Approximately 250 s
* 177T: Approximately 300 s
* 236T: Approximately 350 s
* **DS19784:**
* 59T: Approximately 550 s
* 118T: Approximately 350 s
* 177T: Approximately 300 s
* 236T: Approximately 350 s
* **DS13070:**
* 59T: Approximately 350 s
* 118T: Approximately 250 s
* 177T: Approximately 250 s
* 236T: Approximately 300 s
* **DS3526:**
* 59T: Approximately 400 s
* 118T: Approximately 300 s
* 177T: Approximately 300 s
* 236T: Approximately 350 s
### Key Observations
* The time taken varies significantly depending on the dataset and the algorithm used.
* In chart (a), algorithm 59T consistently takes the longest time for most datasets. Algorithm 236T takes the longest time for DS3526.
* In chart (b), algorithm 59T generally takes the longest time, but the differences between algorithms are less pronounced than in chart (a).
* In chart (c), the time differences between algorithms are relatively small, and algorithm 59T is not always the slowest.
* DS3526 consistently requires a longer processing time than other datasets in charts (a) and (b).
### Interpretation
The charts compare the performance of four different algorithms (59T, 118T, 177T, and 236T) across four different datasets (DS21050, DS19784, DS13070, and DS3526). The data suggests that the optimal algorithm depends on the specific dataset being processed.
The variations in performance across datasets indicate that the algorithms have different strengths and weaknesses depending on the characteristics of the data. For example, algorithm 59T may be well-suited for certain types of data but less efficient for others.
The consistent longer processing time for DS3526 suggests that this dataset is more complex or requires more computational resources than the other datasets. This could be due to its size, structure, or the nature of the data it contains.
The differences between the three charts (a), (b), and (c) could represent different experimental conditions, data preprocessing steps, or hardware configurations. Without further information, it is difficult to determine the exact reason for these variations. However, the consistent trends within each chart provide valuable insights into the relative performance of the algorithms.