## Bar Charts: Time Comparison Across DS Labels and T Categories
### Overview
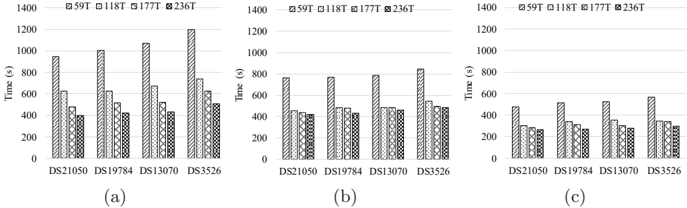
The image contains three bar charts (a, b, c) comparing time values (in seconds) across four categories (59T, 118T, 177T, 236T) for four datasets (DS21050, DS19784, DS13070, DS3526). Each chart uses distinct bar patterns and colors to differentiate categories, with consistent axis labels and a shared legend.
### Components/Axes
- **X-axis**: Labeled "DS21050", "DS19784", "DS13070", "DS3526" (repeated across all charts).
- **Y-axis**: Labeled "Time (s)" with a scale from 0 to 1400.
- **Legend**: Located on the right, mapping categories to patterns/colors:
- **59T**: Square (■), Gray
- **118T**: Diamond (◇), Light Gray
- **177T**: Triangle (▲), Dark Gray
- **236T**: Circle (●), Black
### Detailed Analysis
#### Chart (a)
- **59T (■)**:
- DS21050: ~950s
- DS19784: ~1000s
- DS13070: ~1050s
- DS3526: ~1200s
- **118T (◇)**:
- DS21050: ~650s
- DS19784: ~600s
- DS13070: ~650s
- DS3526: ~700s
- **177T (▲)**:
- DS21050: ~700s
- DS19784: ~650s
- DS13070: ~700s
- DS3526: ~750s
- **236T (●)**:
- DS21050: ~450s
- DS19784: ~420s
- DS13070: ~440s
- DS3526: ~480s
#### Chart (b)
- **59T (■)**:
- DS21050: ~780s
- DS19784: ~780s
- DS13070: ~790s
- DS3526: ~840s
- **118T (◇)**:
- DS21050: ~480s
- DS19784: ~480s
- DS13070: ~490s
- DS3526: ~500s
- **177T (▲)**:
- DS21050: ~490s
- DS19784: ~490s
- DS13070: ~490s
- DS3526: ~500s
- **236T (●)**:
- DS21050: ~440s
- DS19784: ~440s
- DS13070: ~440s
- DS3526: ~480s
#### Chart (c)
- **59T (■)**:
- DS21050: ~500s
- DS19784: ~500s
- DS13070: ~500s
- DS3526: ~580s
- **118T (◇)**:
- DS21050: ~320s
- DS19784: ~320s
- DS13070: ~320s
- DS3526: ~340s
- **177T (▲)**:
- DS21050: ~330s
- DS19784: ~330s
- DS13070: ~330s
- DS3526: ~340s
- **236T (●)**:
- DS21050: ~280s
- DS19784: ~280s
- DS13070: ~280s
- DS3526: ~300s
### Key Observations
1. **Consistent Trends**: Across all charts, **59T** consistently has the highest time, while **236T** has the lowest. This inverse relationship holds for all datasets.
2. **Magnitude Differences**:
- In chart (a), time values for 59T are ~2–3x higher than 236T.
- In chart (c), the gap narrows (59T ~1.7x higher than 236T).
3. **Dataset Variability**:
- DS3526 generally shows higher time values than other datasets, especially in chart (a) (1200s for 59T).
- DS21050 and DS19784 exhibit similar trends across charts.
### Interpretation
The data suggests a **negative correlation between T values and time**: higher T values (e.g., 236T) correspond to shorter processing times. This could indicate:
- **Efficiency Gains**: Larger T values (possibly representing computational resources or iterations) reduce processing time.
- **Scalability**: The system scales better with increased T, though diminishing returns are observed in chart (c).
- **Dataset-Specific Factors**: DS3526’s higher baseline times may reflect inherent complexity or larger data size.
Notably, chart (c) shows the smallest time differences between categories, implying potential optimization or saturation effects at higher T values. The consistency across datasets reinforces the reliability of this trend.