## Line Graph: Sex-Based Trend Comparison
### Overview
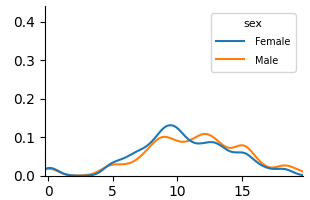
The image depicts a line graph comparing two data series labeled "Female" (blue) and "Male" (orange) across an x-axis range of 0 to 15. The y-axis ranges from 0 to 0.4. Both lines exhibit oscillating trends with peaks and troughs, suggesting a cyclical or variable relationship between the x-axis variable and the measured metric.
### Components/Axes
- **X-axis**: Unlabeled numerical scale (0–15), likely representing a continuous variable (e.g., age, time, or index).
- **Y-axis**: Unlabeled numerical scale (0–0.4), possibly representing a proportion, probability, or normalized value.
- **Legend**: Located in the top-right corner, with:
- **Blue line**: Labeled "Female"
- **Orange line**: Labeled "Male"
### Detailed Analysis
1. **Female (Blue Line)**:
- Begins near 0 at x=0.
- Rises gradually, peaking at ~x=10 with a value of ~0.15.
- Declines sharply after x=10, reaching ~0.05 by x=15.
- Exhibits minor fluctuations (e.g., a small dip at x=12).
2. **Male (Orange Line)**:
- Starts near 0 at x=0.
- Rises more gradually than Female, peaking at ~x=10 with a value of ~0.12.
- Declines after x=10 but shows a secondary peak at ~x=12 (~0.08).
- Ends at ~0.03 by x=15.
3. **Intersections**:
- Lines cross near x=8 (Female > Male) and x=12 (Male > Female), indicating a crossover in trends.
### Key Observations
- Both lines share similar overall shapes but differ in magnitude and timing of peaks.
- Female values consistently exceed Male values until x=12, where Male surpasses Female.
- Male exhibits a secondary peak at x=12, absent in Female data.
### Interpretation
The graph suggests a sex-based divergence in a measured metric (e.g., health outcome, behavioral pattern) over a continuous variable (x-axis). The higher peak for Female at x=10 implies a stronger association for this group at that point. The Male secondary peak at x=12 may indicate a delayed or distinct response. The crossover at x=12 highlights a critical threshold where Male trends dominate. Without contextual labels, the exact nature of the x-axis variable remains ambiguous, but the relative trends emphasize sex-specific differences in the measured phenomenon.