# Technical Document Extraction: Task Complexity Diagrams
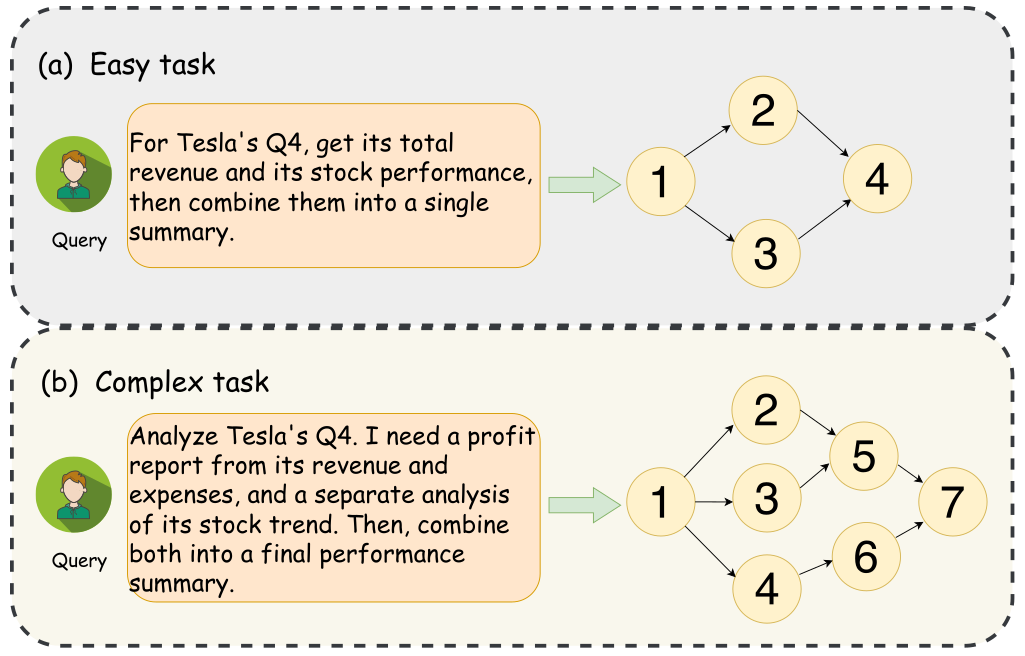
This image illustrates the conceptual mapping of natural language queries to computational task graphs, categorized by complexity levels: (a) Easy task and (b) Complex task.
---
## 1. Component Segmentation
The image is divided into two primary horizontal sections, each enclosed in a dashed rounded rectangle.
### Section (a): Easy Task
* **Header Label:** `(a) Easy task`
* **Input Component (Query):**
* **Icon:** A circular green avatar representing a user.
* **Label:** `Query`
* **Text Content:** "For Tesla's Q4, get its total revenue and its stock performance, then combine them into a single summary."
* **Transition:** A light green arrow points from the query text box to a directed acyclic graph (DAG).
* **Output Component (Graph):** A 4-node diamond-shaped workflow.
* **Node 1:** Initial state/entry point.
* **Nodes 2 & 3:** Parallel processing steps branching from Node 1.
* **Node 4:** Convergence/summary point where paths from Node 2 and Node 3 meet.
### Section (b): Complex Task
* **Header Label:** `(b) Complex task`
* **Input Component (Query):**
* **Icon:** A circular green avatar representing a user.
* **Label:** `Query`
* **Text Content:** "Analyze Tesla's Q4. I need a profit report from its revenue and expenses, and a separate analysis of its stock trend. Then, combine both into a final performance summary."
* **Transition:** A light green arrow points from the query text box to a directed acyclic graph (DAG).
* **Output Component (Graph):** A 7-node multi-layered workflow.
* **Node 1:** Initial state/entry point.
* **Nodes 2, 3, & 4:** Parallel processing steps branching from Node 1.
* **Node 5:** Convergence point for outputs from Node 2 and Node 3.
* **Node 6:** Sequential step following Node 4.
* **Node 7:** Final convergence/summary point where paths from Node 5 and Node 6 meet.
---
## 2. Data Extraction & Logic Flow
### Task Comparison Table
| Feature | (a) Easy Task | (b) Complex Task |
| :--- | :--- | :--- |
| **Query Intent** | Retrieve two data points and summarize. | Analyze profit (revenue/expenses) + stock trend and summarize. |
| **Total Nodes** | 4 | 7 |
| **Parallelism** | 2-way split (Nodes 2, 3) | 3-way split (Nodes 2, 3, 4) |
| **Dependency Depth** | 3 levels (1 → 2/3 → 4) | 4 levels (1 → 2/3/4 → 5/6 → 7) |
### Graph Connectivity (Adjacency List)
**Graph (a):**
* 1 → 2
* 1 → 3
* 2 → 4
* 3 → 4
**Graph (b):**
* 1 → 2
* 1 → 3
* 1 → 4
* 2 → 5
* 3 → 5
* 4 → 6
* 5 → 7
* 6 → 7
---
## 3. Technical Summary
The diagram demonstrates how increased specificity and multi-step requirements in a natural language prompt (the "Query") result in a more sophisticated computational graph.
* **Easy Task:** Represents a simple "Split-Merge" pattern.
* **Complex Task:** Represents a nested "Split-Merge" pattern with varying path lengths, indicating higher reasoning or processing requirements to fulfill the user's request.