\n
## Diagram: Task Complexity Comparison
### Overview
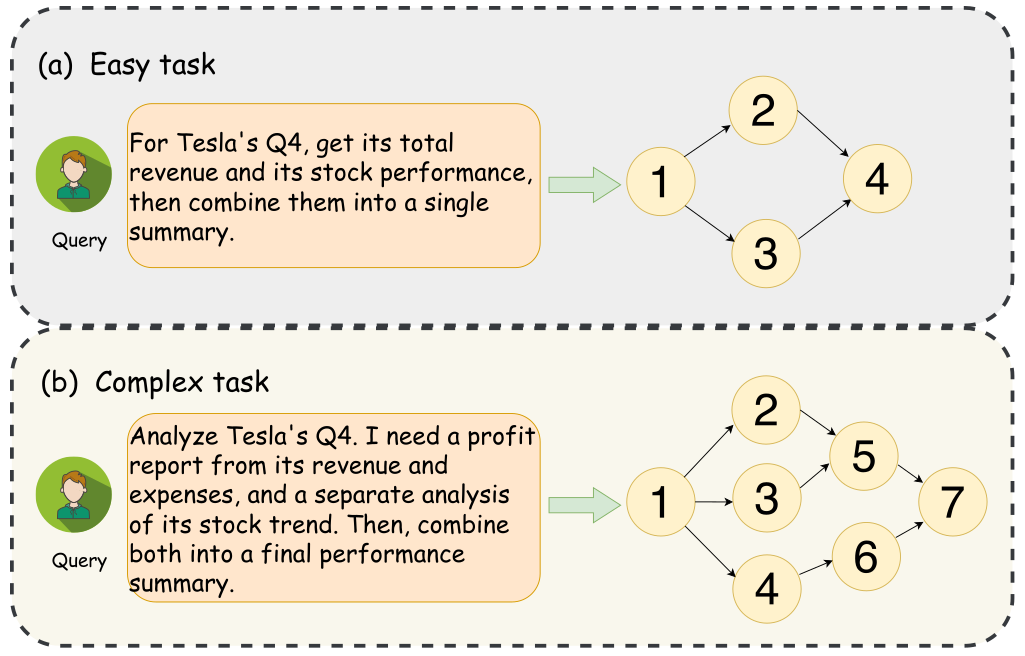
The image presents a diagram comparing the workflow for an "Easy task" and a "Complex task" related to analyzing Tesla's Q4 performance. Both tasks start with a "Query" and proceed through a series of numbered steps represented as yellow circles, connected by arrows indicating the flow of the process. The diagram is visually separated into two sections, (a) and (b), delineated by a dashed line. Each section contains a user icon, a query description, and a flow diagram.
### Components/Axes
The diagram consists of the following components:
* **User Icon:** Represents the initiator of the query.
* **Query Box:** Contains the textual description of the task.
* **Numbered Circles:** Represent individual steps in the task workflow.
* **Arrows:** Indicate the sequence and dependencies between steps.
* **Section Labels:** "(a) Easy task" and "(b) Complex task" identify the two workflows.
* **Dashed Line:** Separates the two workflows visually.
### Detailed Analysis or Content Details
**(a) Easy Task:**
* **Query:** "For Tesla's Q4, get its total revenue and its stock performance, then combine them into a single summary."
* **Flow:**
* Step 1: Initial step, connected to the query.
* Step 2: Connected to Step 1.
* Step 3: Connected to Step 1.
* Step 4: Connected to Step 2 and Step 3.
**(b) Complex Task:**
* **Query:** "Analyze Tesla's Q4. I need a profit report from its revenue and expenses, and a separate analysis of its stock trend. Then, combine both into a final performance summary."
* **Flow:**
* Step 1: Initial step, connected to the query.
* Step 2: Connected to Step 1.
* Step 3: Connected to Step 1.
* Step 4: Connected to Step 3.
* Step 5: Connected to Step 2.
* Step 6: Connected to Step 4.
* Step 7: Connected to Step 5 and Step 6.
### Key Observations
The "Complex task" workflow has more steps (7) than the "Easy task" workflow (4). The "Complex task" also involves branching paths, where steps lead to multiple subsequent steps (e.g., Step 2 and Step 3 both lead to Step 7). The "Easy task" workflow appears more linear.
### Interpretation
The diagram illustrates the increased complexity of a task requiring multiple, independent analyses and subsequent integration of results. The "Easy task" represents a straightforward request for data retrieval and combination, while the "Complex task" requires separate analyses of revenue/expenses and stock trends before a final summary can be generated. The increased number of steps and branching paths in the "Complex task" visually represent the added cognitive load and processing required to complete it. The diagram suggests that breaking down a complex task into smaller, independent components is a key aspect of managing its complexity. The diagram does not provide any quantitative data, but rather focuses on illustrating the structural differences between task complexities.