## Diagram: Task Complexity Comparison
### Overview
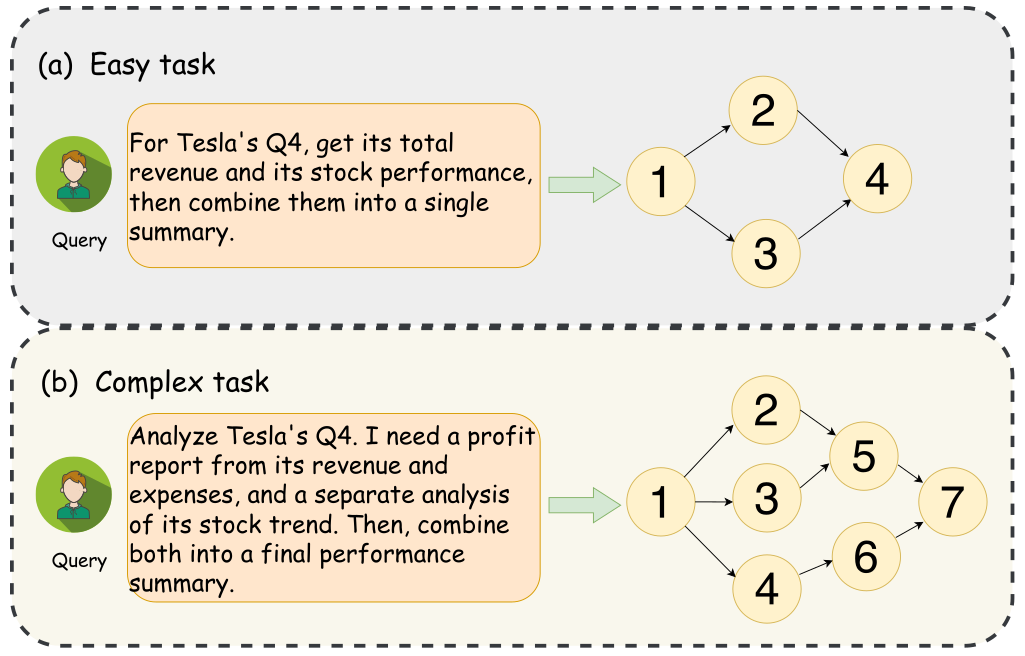
The image is a technical diagram comparing the workflow structures for an "Easy task" versus a "Complex task," using a Tesla Q4 financial analysis as an example. It visually demonstrates how a more detailed query leads to a more intricate processing graph with additional steps and dependencies.
### Components/Axes
The diagram is divided into two main sections, each enclosed in a dashed, rounded rectangle:
1. **Top Section:** Labeled **"(a) Easy task"**.
2. **Bottom Section:** Labeled **"(b) Complex task"**.
Each section contains three core components:
* **Query Source:** Represented by a user icon (a person with brown hair on a green circle) labeled **"Query"**.
* **Query Text:** Contained within a light orange, rounded rectangle.
* **Processing Flowchart:** A directed graph of numbered, circular nodes (light yellow) connected by black arrows, indicating the sequence and flow of operations. A large, light green arrow points from the query box to the start of the flowchart.
### Detailed Analysis
#### (a) Easy Task
* **Query Text:** "For Tesla's Q4, get its total revenue and its stock performance, then combine them into a single summary."
* **Flowchart Structure:**
* **Node 1:** The starting point, receiving the query.
* **Parallel Branches:** Node 1 splits into two independent paths:
* Path to **Node 2**.
* Path to **Node 3**.
* **Convergence:** Both Node 2 and Node 3 point to **Node 4**, which is the final step.
* **Visual Trend/Flow:** A simple, symmetrical diamond shape. The flow is linear from 1, splits into two parallel processes (2 and 3), and merges back into a single final step (4). This represents a straightforward "fetch two items and combine" operation.
#### (b) Complex Task
* **Query Text:** "Analyze Tesla's Q4. I need a profit report from its revenue and expenses, and a separate analysis of its stock trend. Then, combine both into a final performance summary."
* **Flowchart Structure:**
* **Node 1:** The starting point, receiving the more detailed query.
* **Initial Parallel Branches:** Node 1 splits into **three** paths:
* Path to **Node 2**.
* Path to **Node 3**.
* Path to **Node 4**.
* **Intermediate Dependencies & Merging:**
* **Node 2** points to **Node 5**.
* **Node 3** points to **both Node 5 and Node 6**. This is a critical difference, showing Node 3's output is needed for two subsequent steps.
* **Node 4** points to **Node 6**.
* **Final Convergence:** **Node 5** and **Node 6** both point to the final step, **Node 7**.
* **Visual Trend/Flow:** A more complex, asymmetrical graph. It begins with a wider split (three branches). The middle branch (Node 3) acts as a hub, feeding into two different intermediate processes (Nodes 5 and 6). The final summary (Node 7) depends on the completion of two distinct intermediate analyses (Nodes 5 and 6), which themselves have multiple dependencies.
### Key Observations
1. **Query Specificity Drives Complexity:** The complex task query explicitly requests a "profit report" (requiring revenue *and* expenses) and a "separate analysis," which necessitates more granular processing steps compared to the easy task's simple "get" and "combine" instructions.
2. **Increased Parallelism and Interdependency:** The complex task graph has more nodes (7 vs. 4), more initial parallel branches (3 vs. 2), and crucially, introduces a node (Node 3) whose output is required by multiple downstream processes. This reflects the need to handle interconnected data points (e.g., revenue and expenses both feed into a profit calculation).
3. **Structural Analogy:** The easy task graph is a simple diamond. The complex task graph resembles a more intricate network or a small pipeline with a fan-out/fan-in pattern, where initial data is processed in parallel streams that later merge.
### Interpretation
This diagram serves as a conceptual model for how an intelligent system (like an AI agent or a data processing pipeline) might decompose and execute user queries of varying complexity.
* **What it demonstrates:** It visually argues that complex analytical requests cannot be handled by a simple, linear, or shallowly parallel process. They require a structured workflow with multiple stages of processing, where intermediate results are generated and then synthesized in subsequent steps.
* **Relationship between elements:** The query text directly dictates the topology of the processing graph. The numbered nodes represent abstract processing steps (e.g., "fetch revenue data," "calculate profit margin," "analyze stock trend," "generate summary text"). The arrows represent data or control flow.
* **Underlying message:** The diagram highlights the importance of **task decomposition** and **workflow planning** in system design. For the "Complex task," the system must first plan to execute three sub-tasks (Nodes 2, 3, 4), understand that the output of one sub-task (Node 3) is needed for two different analyses (Nodes 5 and 6), and finally orchestrate the combination of those analyses into a final output. This is a foundational concept in areas like AI planning, multi-step reasoning, and complex data pipeline architecture.