## Diagram: Task Flowchart Comparison (Easy vs. Complex)
### Overview
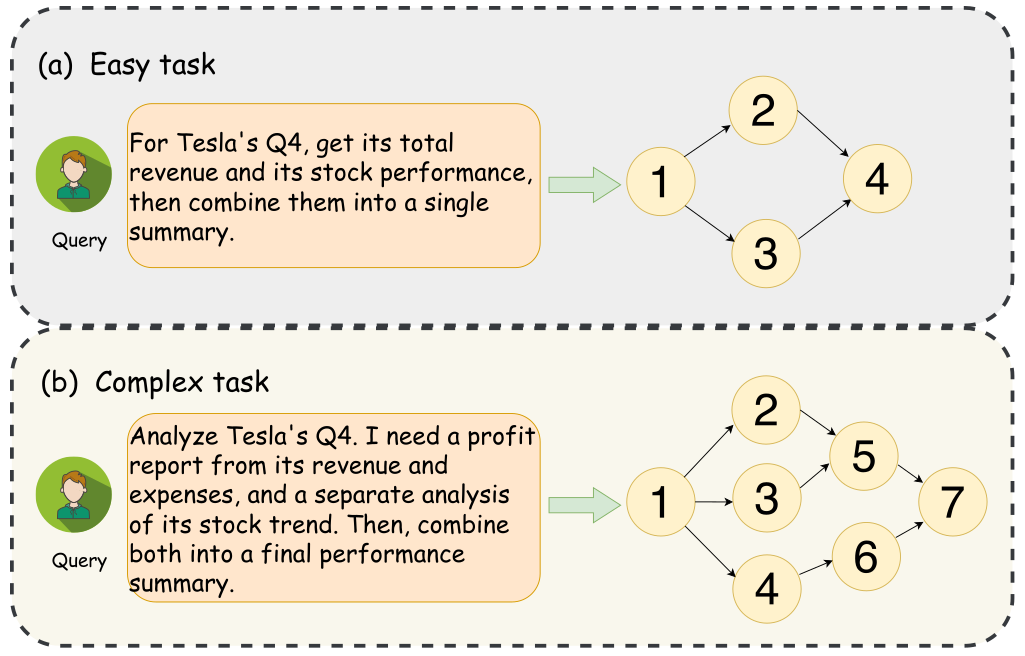
The image compares two task workflows using flowcharts:
- **(a) Easy task**: A linear process to combine Tesla's Q4 revenue and stock performance into a summary.
- **(b) Complex task**: A branched process to analyze Tesla's Q4 profit, revenue, expenses, and stock trends before synthesizing a final summary.
### Components/Axes
#### (a) Easy Task Flowchart
- **Steps**:
1. Gather Tesla's Q4 total revenue.
2. Gather Tesla's Q4 stock performance data.
3. Combine revenue and stock data.
4. Generate a single summary.
- **Arrows**: Sequential flow from Step 1 → 2 → 3 → 4.
#### (b) Complex Task Flowchart
- **Steps**:
1. Gather Tesla's Q4 revenue and expenses.
2. Analyze profit (revenue - expenses).
3. Gather Tesla's Q4 stock trend data.
4. Analyze stock trend.
5. Combine profit and stock trend data.
6. Generate intermediate summary.
7. Final performance summary.
- **Arrows**: Branched flow:
- Step 1 → 2 (profit analysis) and 1 → 3 (stock trend analysis).
- Step 2 → 5 and Step 4 → 5.
- Step 5 → 6 → 7.
### Content Details
- **Queries**:
- (a) "For Tesla's Q4, get its total revenue and its stock performance, then combine them into a single summary."
- (b) "Analyze Tesla's Q4. I need a profit report from its revenue and expenses, and a separate analysis of its stock trend. Then, combine both into a final performance summary."
- **Step Labels**: Numerically labeled (1–4 for easy; 1–7 for complex).
- **Connectors**: Arrows indicate dependencies and flow direction.
### Key Observations
1. **Complexity**: The complex task introduces additional steps (profit analysis, stock trend analysis) compared to the easy task.
2. **Branching**: The complex task splits into parallel sub-tasks (profit and stock trend analysis) before merging results.
3. **Final Output**: Both tasks converge on a "summary," but the complex task requires intermediate synthesis (Step 6).
### Interpretation
- **Process Design**: The diagrams illustrate how task complexity dictates workflow structure. Simple tasks follow linear paths, while complex tasks require decomposition into sub-problems.
- **Data Integration**: The complex task emphasizes separating financial metrics (profit) and market performance (stock trend) before combining them, suggesting a need for nuanced analysis.
- **Efficiency Trade-off**: The easy task prioritizes speed (direct combination), whereas the complex task prioritizes depth (separate analyses).
- **Ambiguity**: The term "stock trend" in the complex task is undefined, potentially requiring further clarification for implementation.
This analysis highlights how workflow design adapts to task requirements, balancing granularity and efficiency.