## Line Graphs: Throughput vs GPU Cache Usage for Different Models and Token Sizes
### Overview
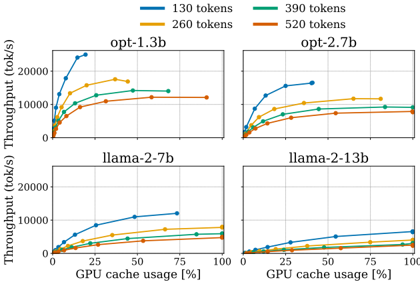
The image contains four line graphs arranged in a 2x2 grid, comparing throughput (tokens/second) against GPU cache usage (%) for four different language models: `opt-1.3b`, `opt-2.7b`, `llama-2-7b`, and `llama-2-13b`. Each graph includes four data series representing token counts (130, 260, 390, 520), differentiated by color. The graphs show how throughput scales with increasing GPU cache utilization for varying model sizes and token sequence lengths.
### Components/Axes
- **X-axis**: GPU cache usage (%) (0–100% in increments of 25%).
- **Y-axis**: Throughput (tokens/second) ranging from 0 to ~20,000.
- **Legend**: Located at the top of the image, associating colors with token counts:
- Blue: 130 tokens
- Orange: 260 tokens
- Green: 390 tokens
- Red: 520 tokens
- **Graph Titles**: Each quadrant is labeled with the model name (e.g., "opt-1.3b" in the top-left).
### Detailed Analysis
#### opt-1.3b (Top-Left)
- **Trend**: All token counts show a steep initial increase in throughput, plateauing near 100% cache usage.
- **Data Points**:
- 130 tokens (blue): ~20,000 tok/s at 100% cache.
- 260 tokens (orange): ~15,000 tok/s at 100% cache.
- 390 tokens (green): ~12,000 tok/s at 100% cache.
- 520 tokens (red): ~10,000 tok/s at 100% cache.
#### opt-2.7b (Top-Right)
- **Trend**: Similar to `opt-1.3b`, but with lower absolute throughput values.
- **Data Points**:
- 130 tokens (blue): ~15,000 tok/s at 100% cache.
- 260 tokens (orange): ~10,000 tok/s at 100% cache.
- 390 tokens (green): ~9,000 tok/s at 100% cache.
- 520 tokens (red): ~8,000 tok/s at 100% cache.
#### llama-2-7b (Bottom-Left)
- **Trend**: Gradual increase in throughput with diminishing returns. Lower performance than `opt` models.
- **Data Points**:
- 130 tokens (blue): ~12,000 tok/s at 100% cache.
- 260 tokens (orange): ~8,000 tok/s at 100% cache.
- 390 tokens (green): ~7,000 tok/s at 100% cache.
- 520 tokens (red): ~6,500 tok/s at 100% cache.
#### llama-2-13b (Bottom-Right)
- **Trend**: Lowest throughput across all models. Minimal improvement at higher cache usage.
- **Data Points**:
- 130 tokens (blue): ~8,000 tok/s at 100% cache.
- 260 tokens (orange): ~5,000 tok/s at 100% cache.
- 390 tokens (green): ~4,500 tok/s at 100% cache.
- 520 tokens (red): ~4,000 tok/s at 100% cache.
### Key Observations
1. **Model Size Impact**: Larger models (`llama-2-13b`) consistently underperform smaller models (`opt-1.3b`) in throughput.
2. **Token Count Tradeoff**: Higher token counts reduce throughput, with diminishing returns as cache usage increases.
3. **Cache Utilization**: All models plateau near 100% cache usage, suggesting saturation of GPU resources.
4. **Color Consistency**: Legend colors (blue, orange, green, red) match data series across all graphs without discrepancies.
### Interpretation
The data demonstrates that model architecture and size significantly influence throughput efficiency. The `opt` models outperform `llama` models, likely due to architectural optimizations. Throughput gains from increased GPU cache usage are most pronounced at lower utilization levels, with diminishing returns as resources approach saturation. This suggests that optimizing for lower token counts or smaller models may yield better performance in cache-constrained environments. The consistent color coding across graphs aids in cross-model comparisons, reinforcing the visual trends.