## Line Graph: Probability Distribution at T = 0.31, Instance 3
### Overview
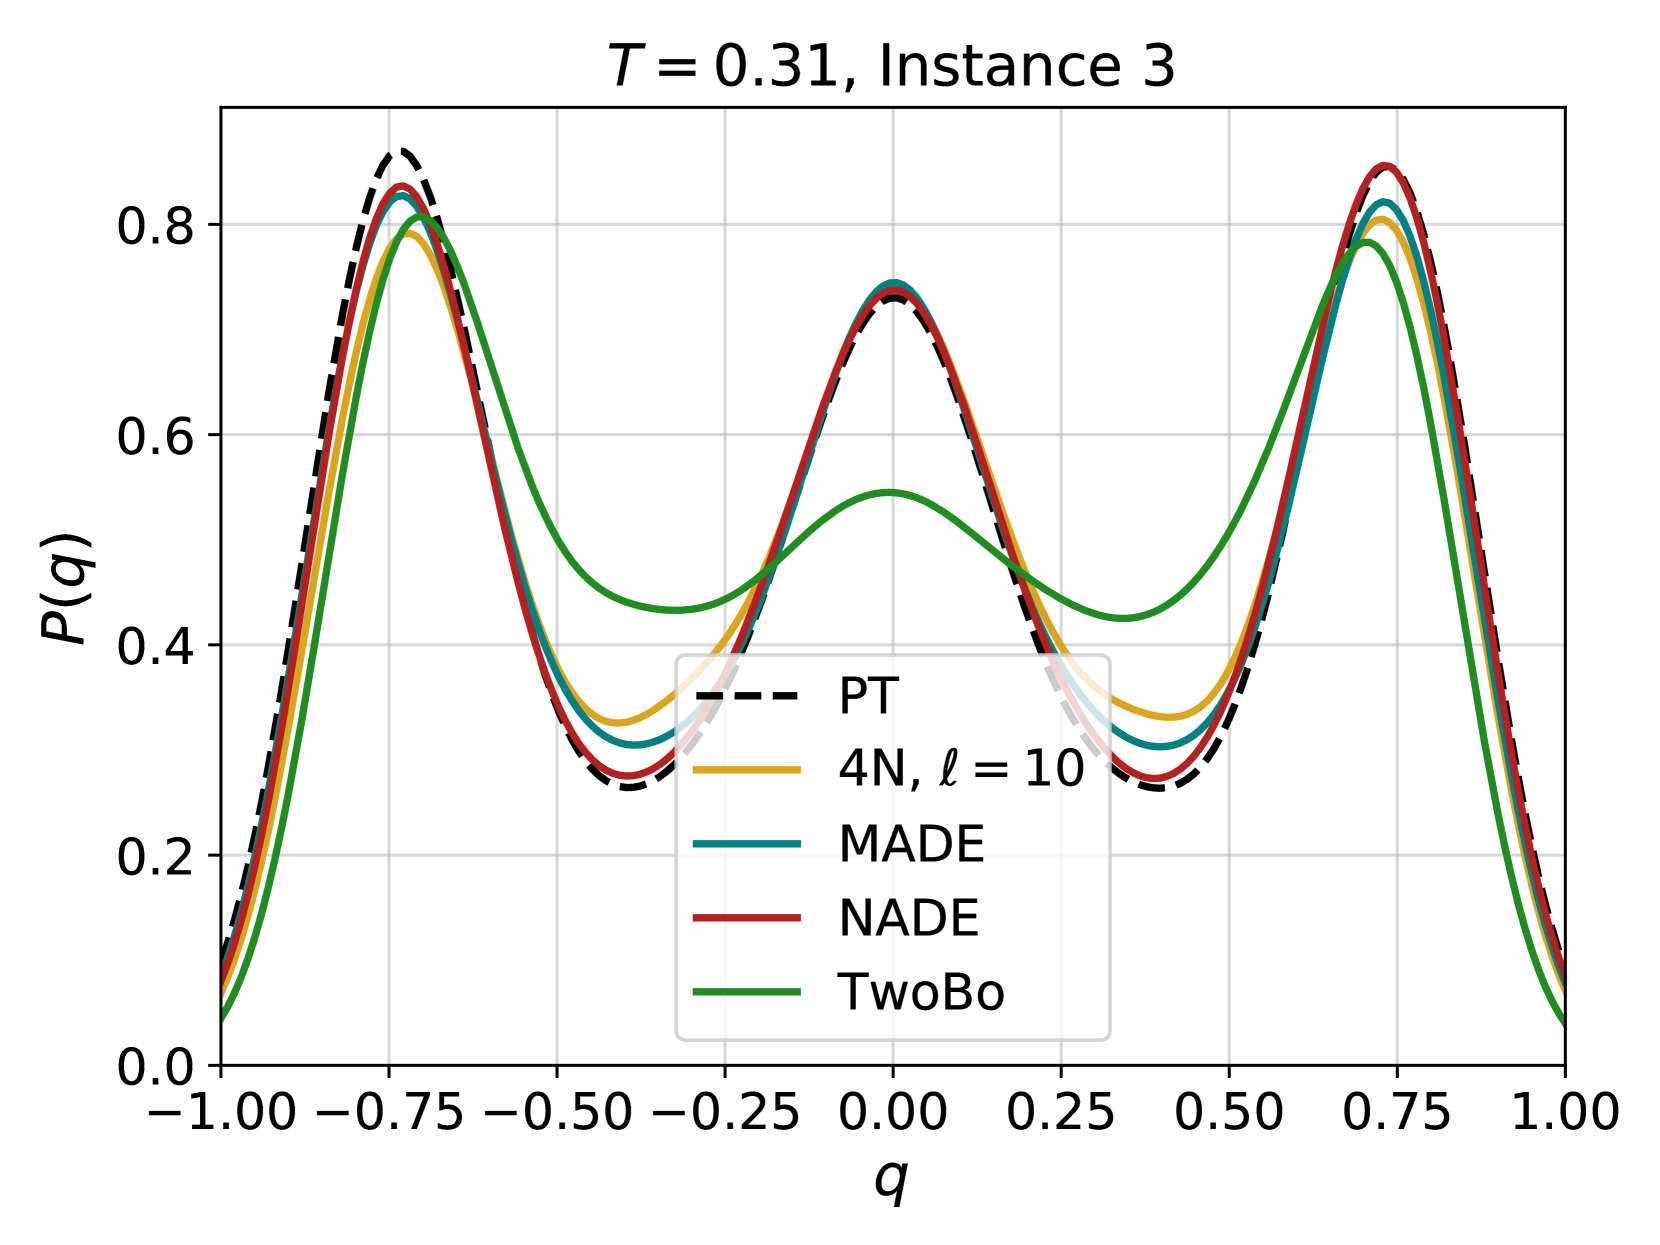
The image is a line graph depicting probability distributions (P(q)) across a normalized parameter q (-1.00 to 1.00) for five distinct models or methods. The graph includes six data series (five solid lines and one dashed line) with varying peak heights and trough depths. The title specifies a temperature parameter (T = 0.31) and instance identifier (Instance 3), suggesting a controlled experimental or simulation context.
### Components/Axes
- **X-axis (q)**: Ranges from -1.00 to 1.00 in increments of 0.25. Labeled "q" with no units specified.
- **Y-axis (P(q))**: Ranges from 0.0 to 0.8 in increments of 0.2. Labeled "P(q)" with no units specified.
- **Legend**: Located in the bottom-right corner, mapping colors to models/methods:
- **Dashed black**: PT
- **Solid yellow**: 4N, ℓ = 10
- **Solid cyan**: MADE
- **Solid red**: NADE
- **Solid green**: TwoBo
### Detailed Analysis
1. **PT (Dashed Black)**:
- Highest peaks (~0.85) at q ≈ ±0.75 and q ≈ 0.25.
- Deepest troughs (~0.15) at q ≈ -0.25 and q ≈ 0.75.
- Symmetric distribution with sharp transitions.
2. **4N, ℓ = 10 (Solid Yellow)**:
- Peaks slightly lower (~0.80) than PT, at similar q values.
- Troughs (~0.20) shallower than PT.
- Smoother curves with less pronounced symmetry.
3. **MADE (Solid Cyan)**:
- Peaks (~0.75) slightly lower than 4N.
- Troughs (~0.25) deeper than 4N but shallower than PT.
- Asymmetric distribution with a slight skew toward positive q.
4. **NADE (Solid Red)**:
- Peaks (~0.78) nearly matching PT but with a slight dip at q ≈ 0.25.
- Troughs (~0.22) deeper than MADE but shallower than PT.
- Symmetric distribution with sharper transitions than MADE.
5. **TwoBo (Solid Green)**:
- Lowest peaks (~0.65) across all q values.
- Shallowest troughs (~0.30).
- Broad, rounded peaks with minimal symmetry.
### Key Observations
- **PT** dominates in peak height and sharpness, suggesting optimal performance or highest probability mass concentration.
- **NADE** and **4N** show intermediate performance, with NADE slightly outperforming 4N in peak height but with less symmetry.
- **TwoBo** exhibits the lowest probability concentrations, indicating weaker performance or broader distribution.
- All models exhibit three peaks, but their relative magnitudes and symmetry differ significantly.
### Interpretation
The data suggests a hierarchy of model performance, with PT achieving the highest probability concentrations (likely indicating better predictive accuracy or parameter estimation). The differences in symmetry and peak sharpness may reflect trade-offs between bias and variance or computational constraints (e.g., ℓ = 10 for 4N). The presence of multiple peaks across all models implies multimodal distributions, which could relate to the underlying problem's complexity (e.g., multiple stable states in a physical system). The temperature parameter (T = 0.31) might modulate these distributions, with higher T potentially broadening peaks (not visible here). The legend's placement ensures clarity, but the absence of units for q and P(q) limits interpretability without additional context.