## Flowchart: Model's Reasoning Process for Answering "Otis Barton was a pioneer in exploring where?"
### Overview
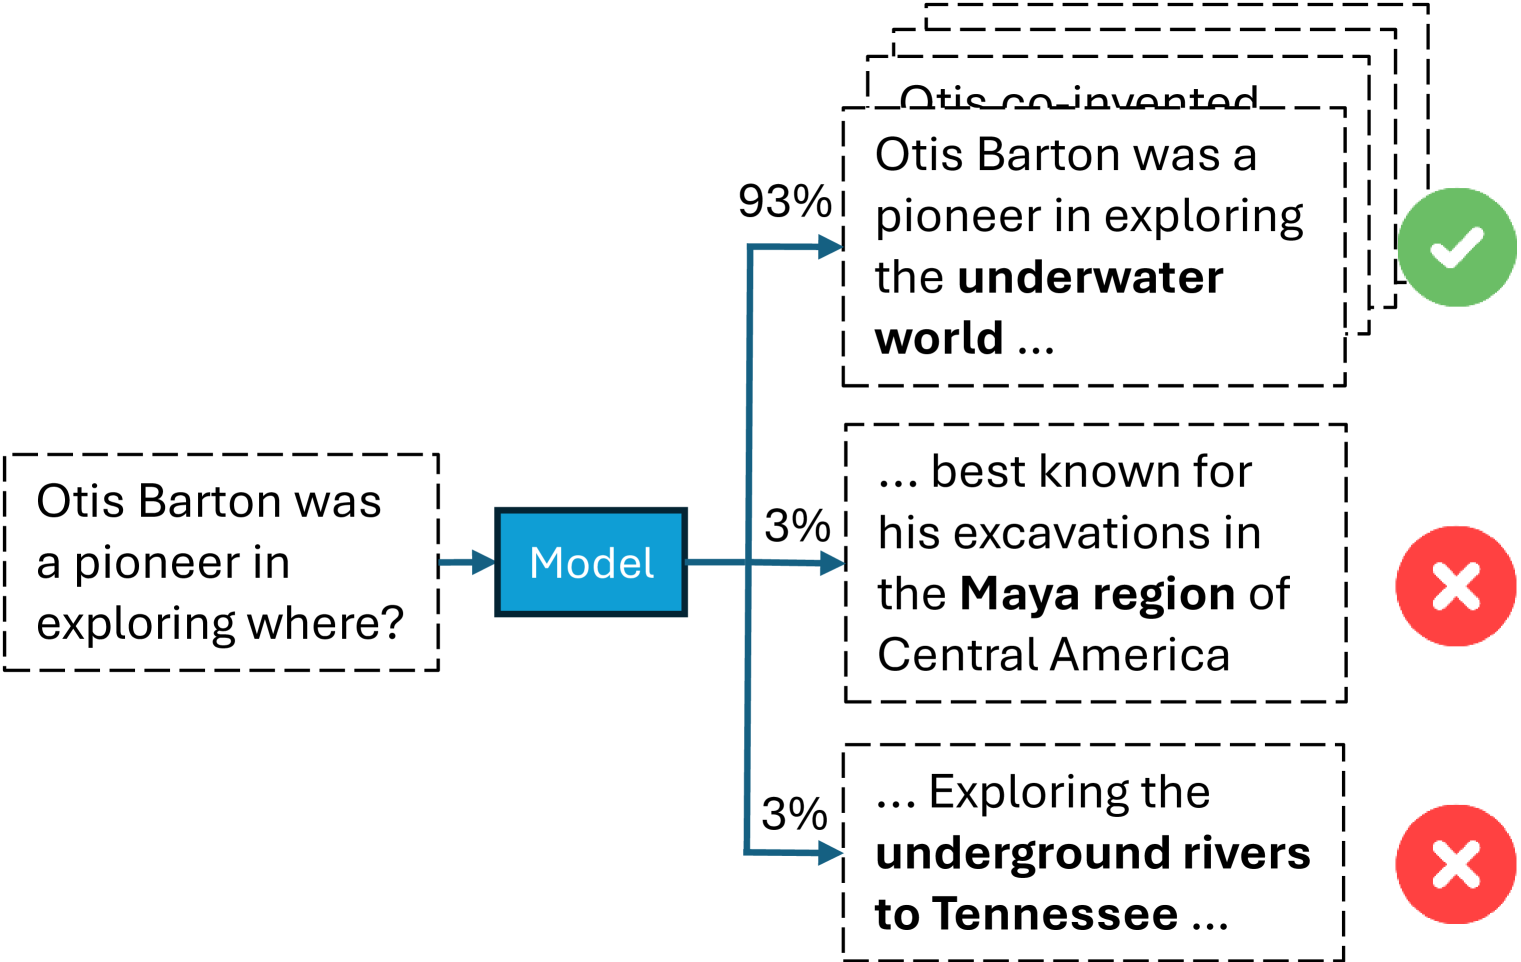
The image depicts a decision tree or flowchart illustrating a language model's reasoning process to answer the question: "Otis Barton was a pioneer in exploring where?" The model evaluates three candidate answers with associated probabilities, using a hierarchical structure to represent confidence levels and correctness.
### Components/Axes
1. **Nodes**:
- **Question Node**: "Otis Barton was a pioneer in exploring where?" (Top-left, black dashed box).
- **Model Node**: "Model" (Central blue box).
- **Answer Nodes**:
- "the underwater world..." (93% probability, green checkmark).
- "his excavations in the Maya region..." (3% probability, red X).
- "Exploring the underground rivers to Tennessee..." (3% probability, red X).
2. **Arrows**:
- Directed edges connect the question to the model, and the model to each answer node.
- Arrows are labeled with probabilities (e.g., "93%", "3%").
3. **Annotations**:
- Green checkmark (✓) for the correct answer.
- Red X (✗) for incorrect answers.
### Detailed Analysis
- **Question Node**: Positioned at the top-left, initiating the reasoning flow.
- **Model Node**: Central hub processing the question and distributing probabilities to answers.
- **Answer Nodes**:
- **Correct Answer**: "the underwater world..." (93% probability, green checkmark).
- **Incorrect Answers**:
- "his excavations in the Maya region..." (3%, red X).
- "Exploring the underground rivers to Tennessee..." (3%, red X).
### Key Observations
1. **Probability Distribution**:
- The correct answer dominates with 93% confidence.
- Two incorrect answers share the remaining 3% probability each, suggesting low confidence in alternatives.
2. **Structural Flow**:
- Hierarchical progression from question → model → answers.
- Visual emphasis on the correct answer via size (larger box) and color (green).
3. **Symbolic Markers**:
- Checkmark/X symbols reinforce correctness/incorrectness, overriding numerical probabilities for immediate interpretation.
### Interpretation
The flowchart demonstrates a probabilistic reasoning mechanism where the model assigns high confidence to the correct answer ("underwater world") based on contextual knowledge of Otis Barton's historical contributions. The near-zero probabilities for alternative answers ("Maya region," "underground rivers") indicate these options are semantically or factually inconsistent with the question's intent. The use of checkmarks/Xs prioritizes human-readable validation over raw numerical outputs, aligning with user-facing interfaces that favor intuitive feedback. This structure highlights the model's ability to filter plausible answers through probabilistic weighting and semantic alignment.