## Diagram: Model Output Analysis
### Overview
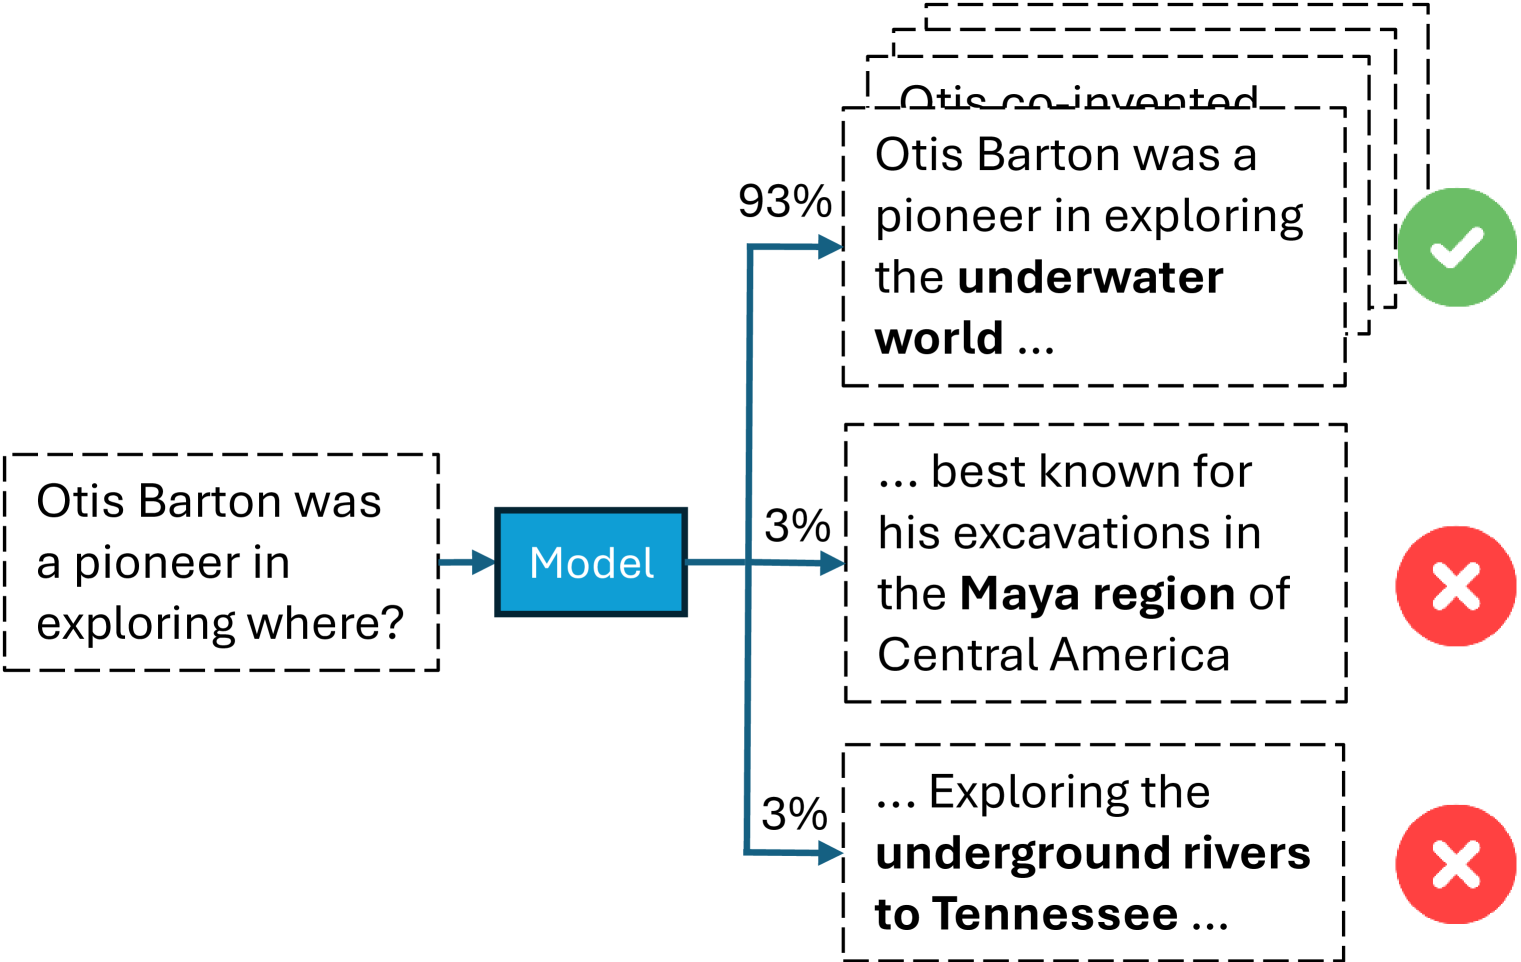
The image depicts a diagram illustrating the output of a model in response to the question "Otis Barton was a pioneer in exploring where?". The model generates multiple possible answers, each associated with a confidence score (percentage). The diagram also indicates whether each answer is considered correct (green checkmark) or incorrect (red X).
### Components/Axes
* **Input Question (Left):** "Otis Barton was a pioneer in exploring where?" - Presented in a dashed-line box.
* **Model (Center):** A blue rectangle labeled "Model".
* **Output Answers (Right):** Three possible answers generated by the model, each in a dashed-line box, along with their confidence scores and correctness indicators.
* **Answer 1:** "Otis Barton was a pioneer in exploring the underwater world..." - Confidence: 93%, Correctness: Green checkmark. There are multiple boxes stacked behind this one, with the top one reading "Otis co-invented..."
* **Answer 2:** "... best known for his excavations in the Maya region of Central America" - Confidence: 3%, Correctness: Red X.
* **Answer 3:** "... Exploring the underground rivers to Tennessee ..." - Confidence: 3%, Correctness: Red X.
* **Arrows:** Blue arrows connect the input question to the "Model" and the "Model" to each of the output answers, indicating the flow of information.
### Detailed Analysis or ### Content Details
* **Input:** The question "Otis Barton was a pioneer in exploring where?" is presented as input to the model.
* **Model Processing:** The "Model" block represents the processing stage where the input question is analyzed.
* **Output Generation:** The model generates three possible answers with associated confidence scores:
* "Otis Barton was a pioneer in exploring the underwater world..." is assigned a 93% confidence score and is marked as correct.
* "... best known for his excavations in the Maya region of Central America" is assigned a 3% confidence score and is marked as incorrect.
* "... Exploring the underground rivers to Tennessee ..." is assigned a 3% confidence score and is marked as incorrect.
### Key Observations
* The model demonstrates a high degree of confidence (93%) in the correct answer ("Otis Barton was a pioneer in exploring the underwater world...").
* The model assigns low confidence scores (3% each) to the incorrect answers.
* The diagram clearly distinguishes between correct and incorrect answers using green checkmarks and red X's, respectively.
### Interpretation
The diagram illustrates the performance of a model in answering a specific question. The high confidence score assigned to the correct answer suggests that the model is effective in identifying the correct response. The low confidence scores assigned to the incorrect answers indicate that the model is also capable of distinguishing between relevant and irrelevant information. The diagram provides a clear and concise overview of the model's output and its accuracy in answering the given question.