# Technical Document Extraction: Token Probability Analysis
## 1. Document Overview
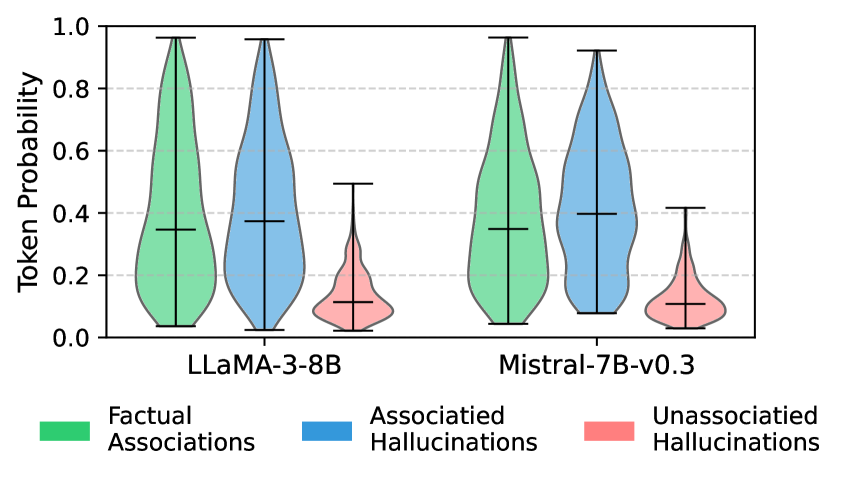
This image is a violin plot comparing the token probability distributions of two Large Language Models (LLMs) across three distinct categories of outputs. The chart visualizes the density, range, and median values of probabilities assigned to specific tokens.
## 2. Component Isolation
### A. Header / Axis Labels
* **Y-Axis Title:** Token Probability
* **Y-Axis Scale:** Linear, ranging from `0.0` to `1.0` with major tick marks and dashed horizontal grid lines at intervals of `0.2`.
* **X-Axis Categories (Models):**
1. LLaMA-3-8B
2. Mistral-7B-v0.3
### B. Legend (Footer)
The legend is located at the bottom of the chart. Note: There are typographical errors in the original labels ("Associatied" instead of "Associated").
* **Green (Left):** Factual Associations
* **Blue (Middle):** Associated Hallucinations
* **Red/Pink (Right):** Unassociated Hallucinations
---
## 3. Data Extraction and Trend Analysis
Each model group contains three violin plots. Each violin includes a vertical line representing the full range (min to max) and a horizontal crossbar representing the median value.
### Model 1: LLaMA-3-8B
| Category | Color | Visual Trend/Shape | Median (Approx) | Range (Approx) |
| :--- | :--- | :--- | :--- | :--- |
| **Factual Associations** | Green | Wide base at 0.2, tapering to a long thin neck reaching near 1.0. | 0.35 | 0.05 to 0.96 |
| **Associated Hallucinations** | Blue | Bimodal-leaning; wide at 0.2 and 0.5, reaching near 1.0. | 0.38 | 0.02 to 0.96 |
| **Unassociated Hallucinations** | Red | Heavily bottom-weighted; bulbous at 0.1, sharp drop-off. | 0.12 | 0.02 to 0.50 |
### Model 2: Mistral-7B-v0.3
| Category | Color | Visual Trend/Shape | Median (Approx) | Range (Approx) |
| :--- | :--- | :--- | :--- | :--- |
| **Factual Associations** | Green | Similar to LLaMA; wide base at 0.2, long neck to 1.0. | 0.35 | 0.05 to 0.96 |
| **Associated Hallucinations** | Blue | More concentrated density between 0.2 and 0.6. | 0.40 | 0.08 to 0.92 |
| **Unassociated Hallucinations** | Red | Heavily bottom-weighted; very low density above 0.2. | 0.11 | 0.03 to 0.42 |
---
## 4. Key Observations and Data Patterns
1. **High-Confidence Hallucinations:** Both models exhibit "Associated Hallucinations" (Blue) with token probabilities reaching as high as ~0.95. This indicates that when a hallucination is contextually "associated," the models can be extremely confident in the incorrect output.
2. **Factual vs. Associated Hallucination Overlap:** The distributions for Green (Factual) and Blue (Associated Hallucinations) are remarkably similar in shape and median. This suggests that token probability alone is a poor discriminator for distinguishing factual statements from contextually relevant hallucinations.
3. **Unassociated Hallucinations:** The "Unassociated Hallucinations" (Red) consistently show the lowest token probabilities. The medians are near 0.1, and the maximum values rarely exceed 0.5. This suggests that completely random or irrelevant hallucinations are typically generated with lower model confidence.
4. **Model Comparison:** The behavior between `LLaMA-3-8B` and `Mistral-7B-v0.3` is highly consistent, suggesting these probability distribution patterns are a common characteristic of current transformer-based LLMs rather than a specific model quirk.