## Violin Plot: Token Probability Distributions for LLMs
### Overview
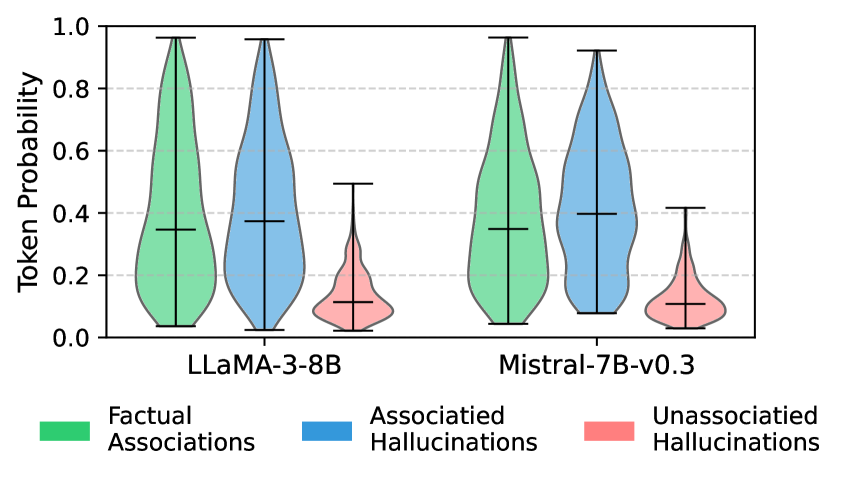
The image presents a comparative violin plot illustrating the distribution of token probabilities for two Large Language Models (LLMs): LLAMA-3-8B and Mistral-7B-v0.3. The distributions are categorized into three types of associations: Factual Associations, Associated Hallucinations, and Unassociated Hallucinations. The y-axis represents "Token Probability," ranging from 0.0 to 1.0.
### Components/Axes
* **X-axis:** Represents the LLM being evaluated. Categories: "LLAMA-3-8B", "Mistral-7B-v0.3".
* **Y-axis:** "Token Probability", with a scale from 0.0 to 1.0, incrementing by 0.2.
* **Violin Plots:** Represent the distribution of token probabilities for each association type within each LLM.
* **Legend:** Located at the bottom of the image, providing color-coding for the association types:
* Green: Factual Associations
* Blue: Associated Hallucinations
* Red: Unassociated Hallucinations
* **Horizontal Lines within Violin Plots:** Represent the median token probability for each association type.
* **Vertical Lines extending from Violin Plots:** Represent the interquartile range (IQR) or confidence intervals.
### Detailed Analysis
Let's analyze each LLM and association type individually, referencing the legend colors for accuracy.
**LLAMA-3-8B:**
* **Factual Associations (Green):** The distribution is centered around approximately 0.45, with a range extending from roughly 0.1 to 0.9. The violin plot is relatively wide, indicating a broader distribution of probabilities.
* **Associated Hallucinations (Blue):** The distribution is centered around approximately 0.35, with a range extending from roughly 0.1 to 0.7. The violin plot is also wide, similar to Factual Associations.
* **Unassociated Hallucinations (Red):** The distribution is centered around approximately 0.1, with a range extending from roughly 0.0 to 0.3. This distribution is narrower and lower than the other two.
**Mistral-7B-v0.3:**
* **Factual Associations (Green):** The distribution is centered around approximately 0.4, with a range extending from roughly 0.1 to 0.85. The violin plot is similar in shape to LLAMA-3-8B's Factual Associations.
* **Associated Hallucinations (Blue):** The distribution is centered around approximately 0.35, with a range extending from roughly 0.1 to 0.7. Similar to LLAMA-3-8B.
* **Unassociated Hallucinations (Red):** The distribution is centered around approximately 0.1, with a range extending from roughly 0.0 to 0.3. Similar to LLAMA-3-8B.
### Key Observations
* For both LLMs, Factual Associations consistently exhibit the highest median token probabilities.
* Associated Hallucinations have lower median token probabilities than Factual Associations, but are still higher than Unassociated Hallucinations.
* Unassociated Hallucinations consistently have the lowest median token probabilities.
* The distributions for Factual Associations and Associated Hallucinations are relatively broad, suggesting a wider range of probabilities for these types of associations.
* The distributions for both LLMs appear visually similar, suggesting comparable behavior in terms of token probability distributions for these association types.
### Interpretation
The data suggests that both LLAMA-3-8B and Mistral-7B-v0.3 assign higher probabilities to factual associations compared to hallucinations. Furthermore, associated hallucinations receive higher probabilities than unassociated hallucinations. This indicates that the models are more confident in generating content that aligns with known facts and that when they do hallucinate, they are more likely to generate content that is at least somewhat related to the input context (associated hallucinations) than completely unrelated content (unassociated hallucinations).
The broad distributions of Factual Associations and Associated Hallucinations suggest that the models can generate a diverse range of responses that are considered factual or related to the context, respectively. The narrower distribution of Unassociated Hallucinations indicates that the models are less likely to generate completely unrelated content.
The visual similarity between the two LLMs suggests that they exhibit similar patterns in token probability distributions for these association types, despite potential differences in their underlying architectures or training data. This could imply that the phenomenon of hallucinations is a common challenge for LLMs, regardless of their specific implementation.