\n
## Violin Plot: Token Probability Distributions for Language Model Outputs
### Overview
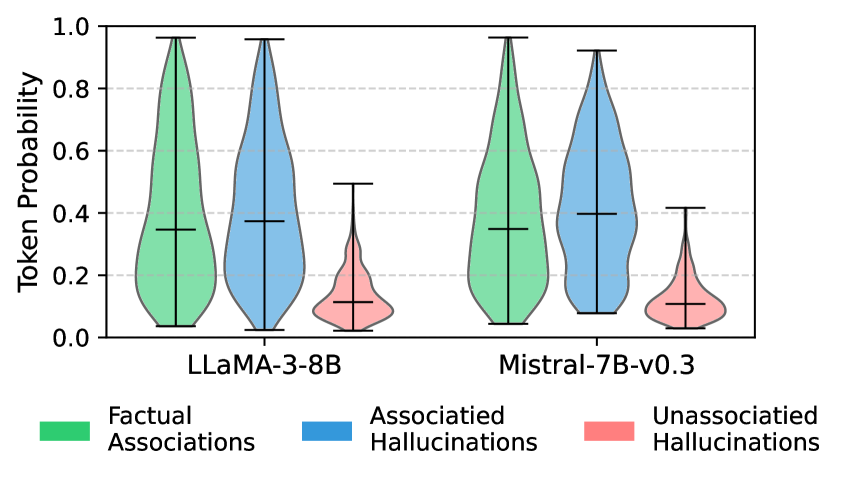
The image is a violin plot comparing the distribution of token probabilities for two large language models (LLMs) across three distinct categories of generated content. The plot visualizes how confidently each model assigns probabilities to tokens associated with factual information versus different types of hallucinations.
### Components/Axes
* **Chart Type:** Violin Plot (a combination of a box plot and a kernel density plot).
* **Y-Axis:** Labeled **"Token Probability"**. The scale runs from 0.0 to 1.0, with major gridlines at intervals of 0.2 (0.0, 0.2, 0.4, 0.6, 0.8, 1.0).
* **X-Axis:** Represents two distinct language models:
1. **LLaMA-3-8B** (left group)
2. **Mistral-7B-v0.3** (right group)
* **Legend:** Positioned at the bottom of the chart, centered. It defines three color-coded categories:
* **Green:** **Factual Associations**
* **Blue:** **Associated Hallucinations**
* **Red:** **Unassociated Hallucinations**
* **Data Series:** For each model, there are three violins, one for each category in the legend, placed side-by-side. Each violin shows the probability density of the data. Inside each violin, a horizontal line marks the median, and vertical lines (whiskers) extend to the rest of the distribution, excluding outliers.
### Detailed Analysis
**1. LLaMA-3-8B (Left Group):**
* **Factual Associations (Green):** The violin is widest between approximately 0.2 and 0.4, indicating the highest density of data points in this range. The median line is at approximately **0.35**. The distribution spans from near 0.0 to just below 1.0, with a relatively broad spread.
* **Associated Hallucinations (Blue):** This violin has a similar shape to the green one but is slightly shifted upward. Its widest point is between ~0.25 and 0.45. The median is slightly higher, at approximately **0.38**. The range is also broad, from near 0.0 to just below 1.0.
* **Unassociated Hallucinations (Red):** This distribution is markedly different. It is much tighter and concentrated at the lower end of the probability scale. The violin is widest between ~0.05 and 0.2. The median is significantly lower, at approximately **0.12**. The overall range is narrow, from 0.0 to about 0.5.
**2. Mistral-7B-v0.3 (Right Group):**
* **Factual Associations (Green):** The shape closely mirrors the green violin for LLaMA-3-8B. The density peaks between ~0.2 and 0.4. The median is approximately **0.35**. The distribution range is similar, from near 0.0 to just below 1.0.
* **Associated Hallucinations (Blue):** This violin also resembles its counterpart in the LLaMA group. The highest density is between ~0.25 and 0.45. The median is around **0.40**, which appears marginally higher than the median for LLaMA's Associated Hallucinations. The range extends from near 0.0 to just below 1.0.
* **Unassociated Hallucinations (Red):** This distribution is again the most constrained. It is concentrated between ~0.05 and 0.2, with a median of approximately **0.10**. The range is very narrow, from 0.0 to about 0.4.
### Key Observations
1. **Consistent Pattern Across Models:** Both LLaMA-3-8B and Mistral-7B-v0.3 exhibit the same fundamental pattern: **Factual Associations** and **Associated Hallucinations** have broadly similar, high-variance distributions with medians in the 0.35-0.40 range. **Unassociated Hallucinations** are distinctly different, with a tight, low-probability distribution (medians ~0.10-0.12).
2. **Low Confidence in Unassociated Hallucinations:** The most striking trend is that both models assign very low token probabilities to "Unassociated Hallucinations." The red violins are short, narrow, and anchored near zero, indicating the models are generally not confident about these tokens.
3. **Similarity Between Factual and Associated Hallucinations:** The green and blue violins for each model are quite similar in shape and median. This suggests the models' confidence levels (as measured by token probability) are comparable when generating factual associations versus hallucinations that are associated with the context.
4. **Model Comparison:** The distributions for Mistral-7B-v0.3 appear very slightly shifted toward higher probabilities compared to LLaMA-3-8B, particularly for Associated Hallucinations (blue median ~0.40 vs ~0.38). However, the difference is subtle, and the overall patterns are highly consistent.
### Interpretation
This chart provides a quantitative look at model confidence across different output types. The data suggests that:
* **Models are "aware" of unassociated nonsense:** The consistently low probabilities for Unassociated Hallucinations indicate the models have learned to assign low confidence to tokens that are contextually irrelevant or nonsensical, which is a desirable trait.
* **The challenge of associated hallucinations:** The fact that Associated Hallucinations receive token probabilities similar to Factual Associations is significant. It implies that when a model generates a plausible-sounding but incorrect statement (an associated hallucination), it does so with a level of internal confidence comparable to when it generates correct information. This makes such hallucinations particularly difficult to detect based on confidence scores alone.
* **Consistency across architectures:** The strong similarity between LLaMA-3-8B and Mistral-7B-v0.3 suggests this probability distribution pattern may be a common characteristic of modern LLMs, rather than an artifact of a specific model's training.
**In essence, the chart visualizes a core challenge in AI safety and reliability: models can be confidently wrong.** They struggle to internally distinguish, via token probability, between factual associations and contextually plausible hallucinations, while they are much better at identifying and downgrading completely unassociated content.