## Diagram: Mathematical/Statistical Region of Interest
### Overview
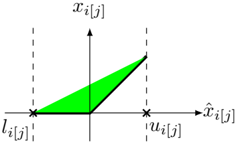
The image depicts a 2D coordinate system with a green shaded triangular region. The axes are labeled with variables involving subscripts and superscripts, suggesting a mathematical or statistical context. The shaded area is bounded by three points, with annotations for key variables.
### Components/Axes
- **Vertical Axis (y-axis)**: Labeled `x_i[j]` (italicized, with subscript `i[j]`).
- **Horizontal Axis (x-axis)**: Labeled `l_i[j]` (italicized, with subscript `i[j]`).
- **Legend**: Located in the top-right corner, with a green color block labeled "Region of Interest".
- **Annotations**:
- `u_i[j]`: Marked on the horizontal axis, positioned to the right of the shaded region.
- `x̂_i[j]`: Marked on the horizontal axis, positioned further right of `u_i[j]`.
### Detailed Analysis
1. **Shaded Region**:
- A right triangle with vertices at:
- `(l_i[j], 0)` (origin of the horizontal axis).
- `(u_i[j], 0)` (end of the base along the horizontal axis).
- `(u_i[j], x_i[j])` (apex of the triangle, aligned vertically with `u_i[j]`).
- The base length is `u_i[j] - l_i[j]`, and the height is `x_i[j]`.
- Area formula: `½ × (u_i[j] - l_i[j]) × x_i[j]`.
2. **Variables**:
- `l_i[j]`: Likely a lower bound or initial value.
- `u_i[j]`: Upper bound or final value on the horizontal axis.
- `x_i[j]`: Vertical measurement, possibly a dependent variable.
- `x̂_i[j]`: Estimated or predicted value, positioned beyond `u_i[j]`.
### Key Observations
- The shaded region’s position and size are determined by the interplay of `l_i[j]`, `u_i[j]`, and `x_i[j]`.
- `x̂_i[j]` lies outside the shaded region, suggesting it may represent an extrapolation or outlier.
- The triangle’s orientation implies a linear relationship between the horizontal and vertical variables within the bounds `l_i[j]` to `u_i[j]`.
### Interpretation
This diagram likely represents a **confidence interval**, **prediction range**, or **parameter space** in a statistical model. The green shaded area could denote a region of significance (e.g., 95% confidence interval), while `x̂_i[j]` might indicate an estimated value outside this range, highlighting uncertainty or variability. The use of subscripts (`i[j]`) suggests this is part of a larger system (e.g., time series, spatial data) where `i` and `j` index specific instances or dimensions.
The diagram emphasizes **bounds** (`l_i[j]`, `u_i[j]`) and **central tendency** (`x_i[j]`), with `x̂_i[j]` serving as a critical point for comparison or hypothesis testing. The absence of numerical values implies this is a generalized representation, applicable to multiple scenarios requiring interval estimation or error analysis.