## Line Chart: Accuracy vs. Thinking Compute for Different Methods
### Overview
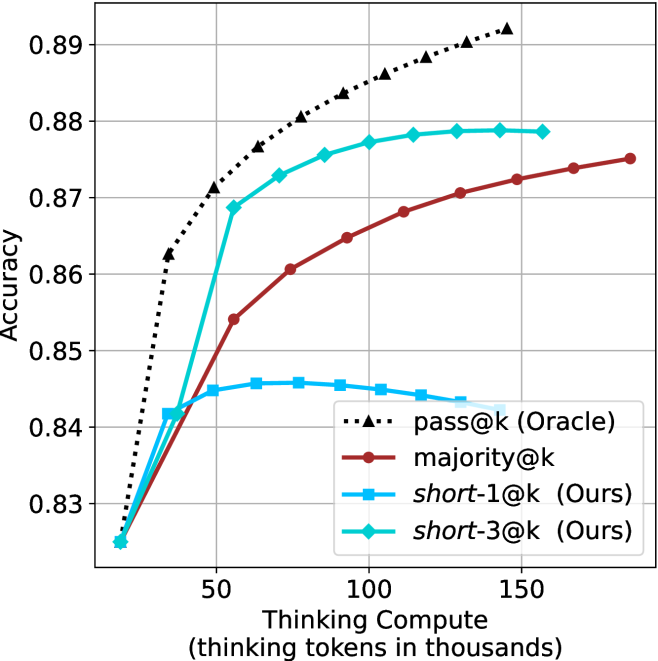
The image is a line chart comparing the performance of four different methods or models. The chart plots "Accuracy" on the vertical axis against "Thinking Compute" (measured in thousands of thinking tokens) on the horizontal axis. The general trend shows that accuracy increases with more compute for most methods, but with different rates and ceilings.
### Components/Axes
* **X-Axis (Horizontal):**
* **Label:** `Thinking Compute (thinking tokens in thousands)`
* **Scale:** Linear scale from approximately 0 to 180 (thousands of tokens).
* **Major Tick Marks:** Labeled at 50, 100, and 150.
* **Y-Axis (Vertical):**
* **Label:** `Accuracy`
* **Scale:** Linear scale from 0.83 to 0.89.
* **Major Tick Marks:** Labeled at 0.83, 0.84, 0.85, 0.86, 0.87, 0.88, and 0.89.
* **Legend (Located in the bottom-right quadrant of the chart area):**
* `pass@k (Oracle)`: Represented by a black dotted line with upward-pointing triangle markers.
* `majority@k`: Represented by a solid dark red (maroon) line with circle markers.
* `short-1@k (Ours)`: Represented by a solid cyan (light blue) line with square markers.
* `short-3@k (Ours)`: Represented by a solid cyan (light blue) line with diamond markers.
### Detailed Analysis
**1. `pass@k (Oracle)` - Black Dotted Line with Triangles**
* **Trend:** Shows a strong, consistent upward logarithmic-like curve. It is the highest-performing method across the entire range of compute shown.
* **Data Points (Approximate):**
* At ~10k tokens: Accuracy ≈ 0.825
* At ~30k tokens: Accuracy ≈ 0.862
* At ~50k tokens: Accuracy ≈ 0.871
* At ~70k tokens: Accuracy ≈ 0.876
* At ~90k tokens: Accuracy ≈ 0.880
* At ~110k tokens: Accuracy ≈ 0.883
* At ~130k tokens: Accuracy ≈ 0.886
* At ~150k tokens: Accuracy ≈ 0.889
* At ~170k tokens: Accuracy ≈ 0.892 (highest point on the chart)
**2. `majority@k` - Solid Red Line with Circles**
* **Trend:** Shows a steady, near-linear upward trend. It consistently performs below the Oracle method but above the `short-1@k` method after the initial compute range.
* **Data Points (Approximate):**
* At ~10k tokens: Accuracy ≈ 0.825 (similar starting point to others)
* At ~50k tokens: Accuracy ≈ 0.854
* At ~70k tokens: Accuracy ≈ 0.860
* At ~90k tokens: Accuracy ≈ 0.865
* At ~110k tokens: Accuracy ≈ 0.868
* At ~130k tokens: Accuracy ≈ 0.870
* At ~150k tokens: Accuracy ≈ 0.872
* At ~170k tokens: Accuracy ≈ 0.874
**3. `short-1@k (Ours)` - Solid Cyan Line with Squares**
* **Trend:** Shows an initial increase, peaks, and then begins a gradual decline. This suggests diminishing returns or potential overfitting/instability with increased compute for this specific method.
* **Data Points (Approximate):**
* At ~10k tokens: Accuracy ≈ 0.825
* At ~30k tokens: Accuracy ≈ 0.842
* At ~50k tokens: Accuracy ≈ 0.845
* At ~70k tokens: Accuracy ≈ 0.846 (peak)
* At ~90k tokens: Accuracy ≈ 0.845
* At ~110k tokens: Accuracy ≈ 0.844
* At ~130k tokens: Accuracy ≈ 0.843
* At ~150k tokens: Accuracy ≈ 0.842
**4. `short-3@k (Ours)` - Solid Cyan Line with Diamonds**
* **Trend:** Shows a rapid initial increase, then plateaus. It significantly outperforms `short-1@k` and approaches the performance of `majority@k` at higher compute levels.
* **Data Points (Approximate):**
* At ~10k tokens: Accuracy ≈ 0.825
* At ~30k tokens: Accuracy ≈ 0.842
* At ~50k tokens: Accuracy ≈ 0.868
* At ~70k tokens: Accuracy ≈ 0.873
* At ~90k tokens: Accuracy ≈ 0.876
* At ~110k tokens: Accuracy ≈ 0.877
* At ~130k tokens: Accuracy ≈ 0.878
* At ~150k tokens: Accuracy ≈ 0.878 (plateau)
### Key Observations
1. **Performance Hierarchy:** The `pass@k (Oracle)` method is the clear upper bound. Among the non-oracle methods, `short-3@k (Ours)` is the best performer, followed by `majority@k`, with `short-1@k (Ours)` being the lowest.
2. **Compute Efficiency:** `short-3@k` achieves high accuracy (~0.878) with relatively low compute (~110k tokens) and then plateaus. `majority@k` requires more compute (~170k tokens) to reach a similar level (~0.874).
3. **Divergent Behavior of "Ours" Methods:** The two methods labeled "(Ours)" show fundamentally different scaling properties. `short-3@k` scales well and plateaus, while `short-1@k` peaks early and degrades.
4. **Common Starting Point:** All four methods appear to converge at the lowest compute level shown (~10k tokens) with an accuracy of approximately 0.825.
### Interpretation
This chart likely comes from a research paper evaluating methods for improving the reasoning or problem-solving accuracy of a language model by allocating more "thinking" compute (tokens). The "Oracle" represents a theoretical or best-possible selection method, serving as a benchmark.
The key finding is that the proposed method `short-3@k` offers a favorable trade-off: it provides a substantial accuracy boost over the baseline `short-1@k` and becomes competitive with the `majority@k` voting approach, but with a clear plateau. This suggests that `short-3@k` efficiently utilizes additional compute up to a point, after which further investment yields minimal gain. In contrast, `short-1@k`'s decline indicates that simply generating more tokens for a single short solution can be counterproductive. The data argues for the effectiveness of the `short-3@k` strategy in balancing performance and computational cost.