## Line Chart: Accuracy vs. Thinking Compute (Tokens in Thousands)
### Overview
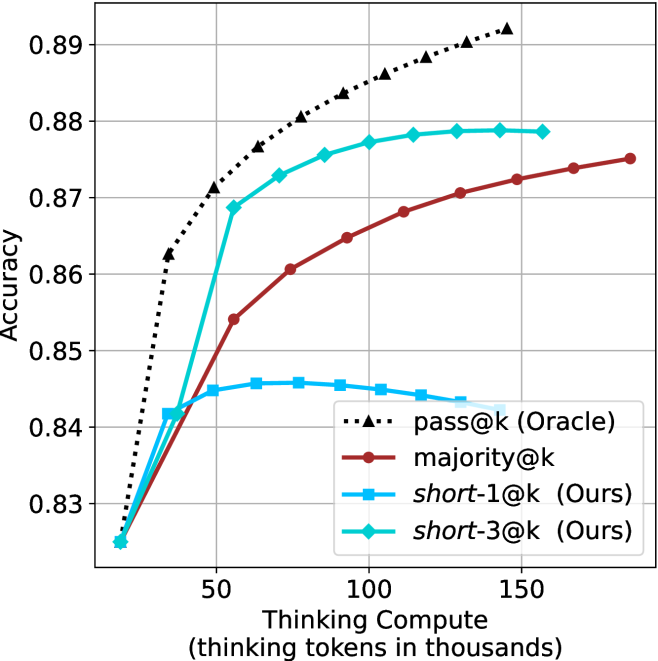
The chart illustrates the relationship between "Thinking Compute" (measured in thousands of thinking tokens) and "Accuracy" across four distinct data series. The y-axis represents accuracy (ranging from 0.83 to 0.89), while the x-axis represents computational effort. Four lines are plotted, each corresponding to a different method or baseline, with varying trends in accuracy as compute increases.
### Components/Axes
- **X-axis**: "Thinking Compute (thinking tokens in thousands)" with values at 0, 50, 100, and 150.
- **Y-axis**: "Accuracy" with values from 0.83 to 0.89.
- **Legend**: Located on the right, with four entries:
- **pass@k (Oracle)**: Black dashed line with triangle markers.
- **majority@k**: Red solid line.
- **short-1@k (Ours)**: Blue solid line.
- **short-3@k (Ours)**: Green solid line.
### Detailed Analysis
1. **pass@k (Oracle)**:
- Starts at 0.83 at 0 tokens.
- Sharp upward trend to 0.88 at 50k tokens.
- Plateaus at ~0.885 by 150k tokens.
- **Key Data Points**:
- 0k: 0.83
- 50k: 0.88
- 150k: 0.885
2. **majority@k**:
- Starts at 0.83 at 0 tokens.
- Gradual upward trend to 0.875 at 150k tokens.
- **Key Data Points**:
- 0k: 0.83
- 50k: 0.86
- 150k: 0.875
3. **short-1@k (Ours)**:
- Starts at 0.83 at 0 tokens.
- Sharp rise to 0.87 at 50k tokens.
- Slight decline to 0.865 at 150k tokens.
- **Key Data Points**:
- 0k: 0.83
- 50k: 0.87
- 150k: 0.865
4. **short-3@k (Ours)**:
- Starts at 0.83 at 0 tokens.
- Rapid increase to 0.88 at 50k tokens.
- Remains flat at 0.88 by 150k tokens.
- **Key Data Points**:
- 0k: 0.83
- 50k: 0.88
- 150k: 0.88
### Key Observations
- **pass@k (Oracle)** achieves the highest accuracy, surpassing all other methods by 50k tokens and maintaining a plateau.
- **short-3@k (Ours)** matches the Oracle's accuracy at 50k tokens but does not improve further, while **majority@k** and **short-1@k** show slower or declining trends.
- **short-1@k (Ours)** exhibits a slight drop in accuracy between 50k and 150k tokens, suggesting potential overfitting or inefficiency at higher compute levels.
- All methods start at the same baseline (0.83) at 0 tokens, indicating no inherent advantage in compute-free scenarios.
### Interpretation
The chart highlights the performance of different computational strategies in achieving accuracy. The **pass@k (Oracle)** represents an idealized benchmark, achieving near-peak accuracy with minimal compute. In contrast, **short-3@k (Ours)** matches this performance at 50k tokens but fails to improve further, suggesting diminishing returns. **majority@k** and **short-1@k** demonstrate slower or inconsistent gains, with the latter showing a notable decline at higher compute levels. This implies that while increased compute can enhance accuracy, the efficiency and scalability of the methods vary significantly. The Oracle's early plateau suggests it may be optimized for specific tasks, whereas other methods require careful tuning to avoid performance degradation.