\n
## Diagram: Deep Neural Network Association
### Overview
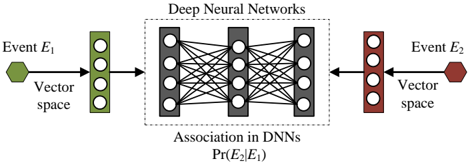
The image depicts a diagram illustrating the association between two events, E1 and E2, using a Deep Neural Network (DNN). The diagram shows how event E1, represented in a vector space, is processed through a DNN to predict or associate with event E2, also represented in a vector space. The association is mathematically represented as Pr(E2|E1).
### Components/Axes
The diagram consists of the following components:
* **Event E1:** Represented by a green hexagon labeled "Event E1" and a column of six green circles labeled "Vector space".
* **Deep Neural Network (DNN):** A central block enclosed in a dashed rectangle labeled "Deep Neural Networks". It contains three layers of nodes:
* Input Layer: Six nodes (white circles).
* Hidden Layer: Eight nodes (white circles).
* Output Layer: Six nodes (white circles).
* Connections: Numerous lines connecting nodes between layers, representing the weights and biases of the network.
* **Event E2:** Represented by a red hexagon labeled "Event E2" and a column of six red circles labeled "Vector space".
* **Association in DNNs:** Text label below the DNN block.
* **Mathematical Notation:** "Pr(E2|E1)" below the "Association in DNNs" label, representing the conditional probability of event E2 given event E1.
### Detailed Analysis or Content Details
The diagram illustrates a flow of information:
1. **Event E1 Input:** Event E1 is initially represented as a vector in a "Vector space" (six green circles).
2. **DNN Processing:** This vector is fed into the input layer of the DNN. The connections between the layers indicate the processing and transformation of the input data.
3. **DNN Output:** The DNN processes the input and produces an output vector.
4. **Event E2 Prediction:** The output vector is associated with Event E2, which is also represented in a "Vector space" (six red circles).
5. **Association Probability:** The entire process represents the probability of Event E2 occurring given Event E1, denoted as Pr(E2|E1).
The DNN has 6 input nodes, 8 nodes in the hidden layer, and 6 output nodes. The connections between the nodes are fully connected, meaning each node in one layer is connected to every node in the next layer.
### Key Observations
The diagram highlights the use of DNNs for modeling associations between events. The vector space representation of events suggests that events are encoded as numerical vectors, allowing for mathematical manipulation and processing by the DNN. The conditional probability notation emphasizes the predictive nature of the model.
### Interpretation
This diagram illustrates a fundamental concept in machine learning, specifically how DNNs can be used to learn and represent relationships between events. The DNN acts as a function that maps the input vector representing Event E1 to an output vector that represents the probability distribution of Event E2. The use of vector spaces allows for a continuous representation of events, enabling the DNN to capture complex relationships that might not be apparent in discrete representations. The diagram suggests that the DNN learns to identify patterns and correlations in the data, allowing it to predict the likelihood of Event E2 occurring given the occurrence of Event E1. The diagram is conceptual and does not provide specific data or numerical values, but rather illustrates the general architecture and flow of information in a DNN-based association model.