## Diagram: Deep Neural Network Event Association
### Overview
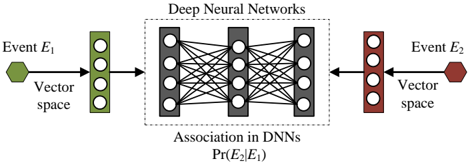
The diagram illustrates the process of event association in deep neural networks (DNNs), showing how input events (E₁) are transformed into output events (E₂) through vector space encoding and neural network processing. The flow is directional, with clear input-output relationships and probabilistic associations.
### Components/Axes
1. **Left Side (Input):**
- **Event E₁**: Represented by a green hexagon labeled "Event E₁"
- **Vector Space**: Green vertical rectangle with 4 white circles (nodes) labeled "Vector space"
- **Flow**: Black arrow from E₁ to vector space
2. **Center (Processing):**
- **Deep Neural Networks**: Gray box containing 3 dense layers of interconnected nodes (circles with black lines)
- **Association Label**: Bottom of DNN box shows "Association in DNNs" with probability notation "Pr(E₂|E₁)"
3. **Right Side (Output):**
- **Vector Space**: Red vertical rectangle with 4 white circles labeled "Vector space"
- **Event E₂**: Red hexagon labeled "Event E₂"
- **Flow**: Black arrow from vector space to E₂
4. **Legend:**
- Green hexagon = Event E₁
- Red hexagon = Event E₂
- Positioned at top-left of diagram
### Detailed Analysis
- **Input Encoding**: Event E₁ is first converted into a 4-dimensional vector representation (4 nodes in green vector space)
- **Neural Network Architecture**:
- 3 dense layers with full interconnections (each node in layer connected to all nodes in adjacent layers)
- Total nodes: 4 (input) + 8 (hidden) + 8 (hidden) + 4 (output) = 24 nodes
- **Output Decoding**: Processed vector space (4 nodes in red) is converted back to Event E₂ representation
- **Probabilistic Association**: Explicitly labeled as conditional probability Pr(E₂|E₁) indicating learned dependency between events
### Key Observations
1. Symmetrical vector space representations for both input and output events
2. Consistent node count (4 nodes) in both input and output vector spaces
3. Dense layer configuration follows standard DNN architecture patterns
4. Explicit probabilistic notation grounds the association in statistical terms
### Interpretation
This diagram demonstrates how DNNs learn temporal or causal relationships between events through:
1. **Feature Encoding**: Converting raw events into vector representations
2. **Non-linear Transformation**: Through multiple dense layers capturing complex patterns
3. **Probabilistic Output**: Modeling event dependencies as conditional probabilities
The symmetrical architecture suggests the network learns bidirectional relationships between events, though the directional flow emphasizes E₁→E₂ prediction. The use of vector spaces implies dimensionality reduction/feature extraction capabilities, while the dense layers enable capture of intricate event associations. The explicit probability notation grounds the model's output in statistical inference rather than deterministic mapping.