\n
## Scatter Plot: Accuracy vs. Time-to-Answer
### Overview
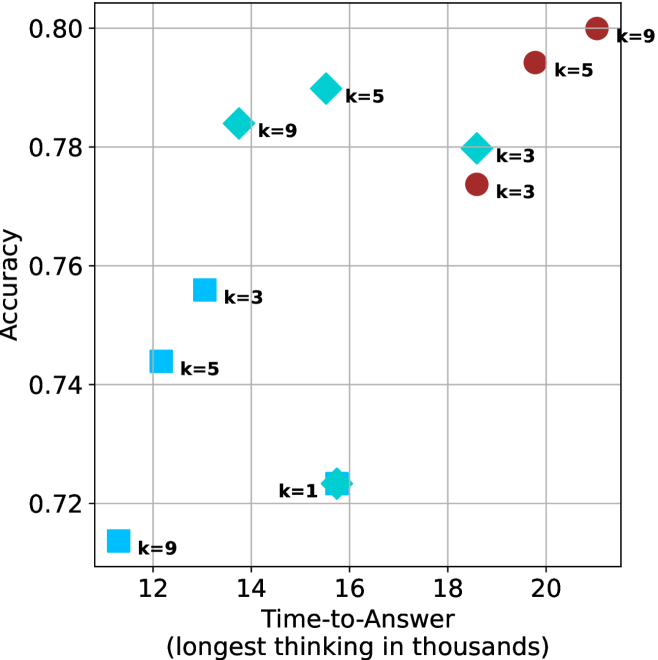
This image presents a scatter plot visualizing the relationship between "Accuracy" and "Time-to-Answer (longest thinking in thousands)". Each data point represents a specific configuration, labeled with a 'k' value. The plot uses different colors to distinguish between different 'k' values.
### Components/Axes
* **X-axis:** "Time-to-Answer (longest thinking in thousands)". Scale ranges from approximately 11.5 to 21.
* **Y-axis:** "Accuracy". Scale ranges from approximately 0.71 to 0.81.
* **Data Points:** Scatter points, each labeled with a 'k' value (k=1, k=3, k=5, k=9).
* **Colors:**
* Blue: k=9
* Light Blue: k=3
* Green: k=5
* Red: k=1
### Detailed Analysis
The plot shows the distribution of accuracy scores against time-to-answer for different values of 'k'.
* **k=1 (Red):** One data point at approximately (16.5, 0.73) and another at approximately (20.5, 0.80). The trend is upward.
* **k=3 (Light Blue):** Data points at approximately (12.5, 0.75), (14.5, 0.77), and (20.5, 0.78). The trend is slightly upward.
* **k=5 (Green):** Data points at approximately (13.5, 0.74), (16.5, 0.78). The trend is upward.
* **k=9 (Blue):** Data points at approximately (12.0, 0.72), (14.0, 0.79), and (20.0, 0.80). The trend is upward.
### Key Observations
* Generally, as "Time-to-Answer" increases, "Accuracy" also tends to increase.
* The 'k=9' configuration shows a relatively wide range of "Time-to-Answer" values, with corresponding accuracy values.
* The 'k=1' configuration has the lowest accuracy at lower time-to-answer, but reaches the highest accuracy at the highest time-to-answer.
* There is overlap in the accuracy ranges for different 'k' values, particularly between k=3, k=5, and k=9.
### Interpretation
The data suggests that increasing the "Time-to-Answer" generally improves "Accuracy" across different 'k' values. The 'k' parameter likely represents a configuration setting or a model complexity. The plot demonstrates a trade-off between speed (Time-to-Answer) and accuracy. Higher 'k' values seem to allow for higher accuracy, but also exhibit a wider range of response times. The 'k=1' configuration is interesting because it starts with lower accuracy but achieves the highest accuracy at the longest thinking time. This could indicate that it requires more processing time to reach optimal performance. The overlapping accuracy ranges suggest that different configurations can achieve similar levels of accuracy, but with varying response times. Further investigation would be needed to understand the specific meaning of 'k' and the underlying mechanisms driving these trends.