## Scatter Plot: Accuracy vs. Time-to-Answer (Longest Thinking in Thousands)
### Overview
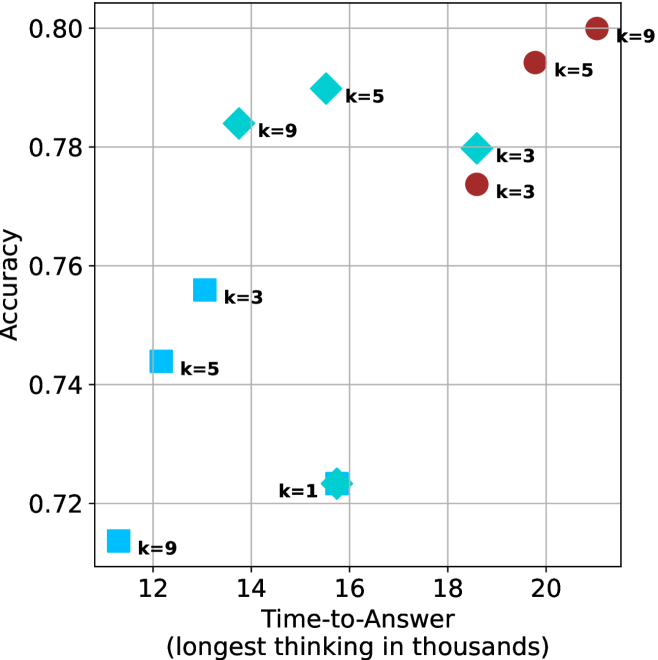
The image is a scatter plot comparing **Accuracy** (y-axis) against **Time-to-Answer (longest thinking in thousands)** (x-axis). Data points are color-coded by a parameter `k` (k=1, 3, 5, 9), with distinct markers for each group. The plot highlights trade-offs between computational effort (time) and performance (accuracy).
---
### Components/Axes
- **X-axis (Time-to-Answer)**:
- Label: "Time-to-Answer (longest thinking in thousands)"
- Scale: 12 to 21 (thousands), with gridlines at integer intervals.
- **Y-axis (Accuracy)**:
- Label: "Accuracy"
- Scale: 0.72 to 0.80, with gridlines at 0.02 intervals.
- **Legend**:
- Position: Top-right corner.
- Colors:
- Blue squares: `k=3`
- Cyan diamonds: `k=5`
- Red circles: `k=9`
- Additional marker: Cyan hexagon labeled `k=1` (single outlier).
---
### Detailed Analysis
#### Data Points by `k` Group
1. **`k=3` (Blue Squares)**:
- Points:
- (12, 0.74)
- (14, 0.78)
- (18, 0.77)
- (20, 0.77)
- Trend: Slight upward trend followed by plateau. Accuracy stabilizes near 0.77–0.78 after 14k time.
2. **`k=5` (Cyan Diamonds)**:
- Points:
- (13, 0.78)
- (15, 0.79)
- (16, 0.74)
- (17, 0.78)
- Trend: Initial rise to 0.79 at 15k, sharp drop to 0.74 at 16k, then recovery. Notable outlier at 16k.
3. **`k=9` (Red Circles)**:
- Points:
- (12, 0.72)
- (19, 0.79)
- (21, 0.80)
- Trend: Low accuracy at 12k, sharp increase to 0.80 at 21k. Highest accuracy but longest time.
4. **`k=1` (Cyan Hexagon)**:
- Single point: (16, 0.72)
- Position: Overlaps with `k=5` group but distinct marker.
---
### Key Observations
1. **Accuracy-Time Trade-off**:
- Higher `k` values (longer time) generally correlate with higher accuracy, but exceptions exist (e.g., `k=5` at 16k).
- `k=9` achieves the highest accuracy (0.80) but requires the longest time (21k).
2. **Outliers**:
- `k=5` at 16k (0.74) deviates from its upward trend.
- `k=1` at 16k (0.72) is an isolated low-accuracy point.
3. **Group Behavior**:
- `k=3` shows consistency but lower peak accuracy (~0.78).
- `k=5` exhibits volatility, with a significant dip at 16k.
- `k=9` demonstrates a clear upward trajectory but starts with the lowest accuracy.
---
### Interpretation
The plot suggests that increasing computational effort (`k`) improves accuracy, but the relationship is non-linear and context-dependent. The `k=9` group achieves the best performance but at the cost of significantly longer processing time, indicating a potential trade-off between speed and precision. The outlier at `k=5` (16k) warrants further investigation—it may represent a computational bottleneck or an anomaly in the dataset. The `k=1` point, while an outlier, highlights the variability in performance even at minimal computational effort. This data could inform optimization strategies, such as balancing `k` values to meet specific accuracy-time requirements.