\n
## Heatmap: Zero-shot - Core Generalization - GPT-4o
### Overview
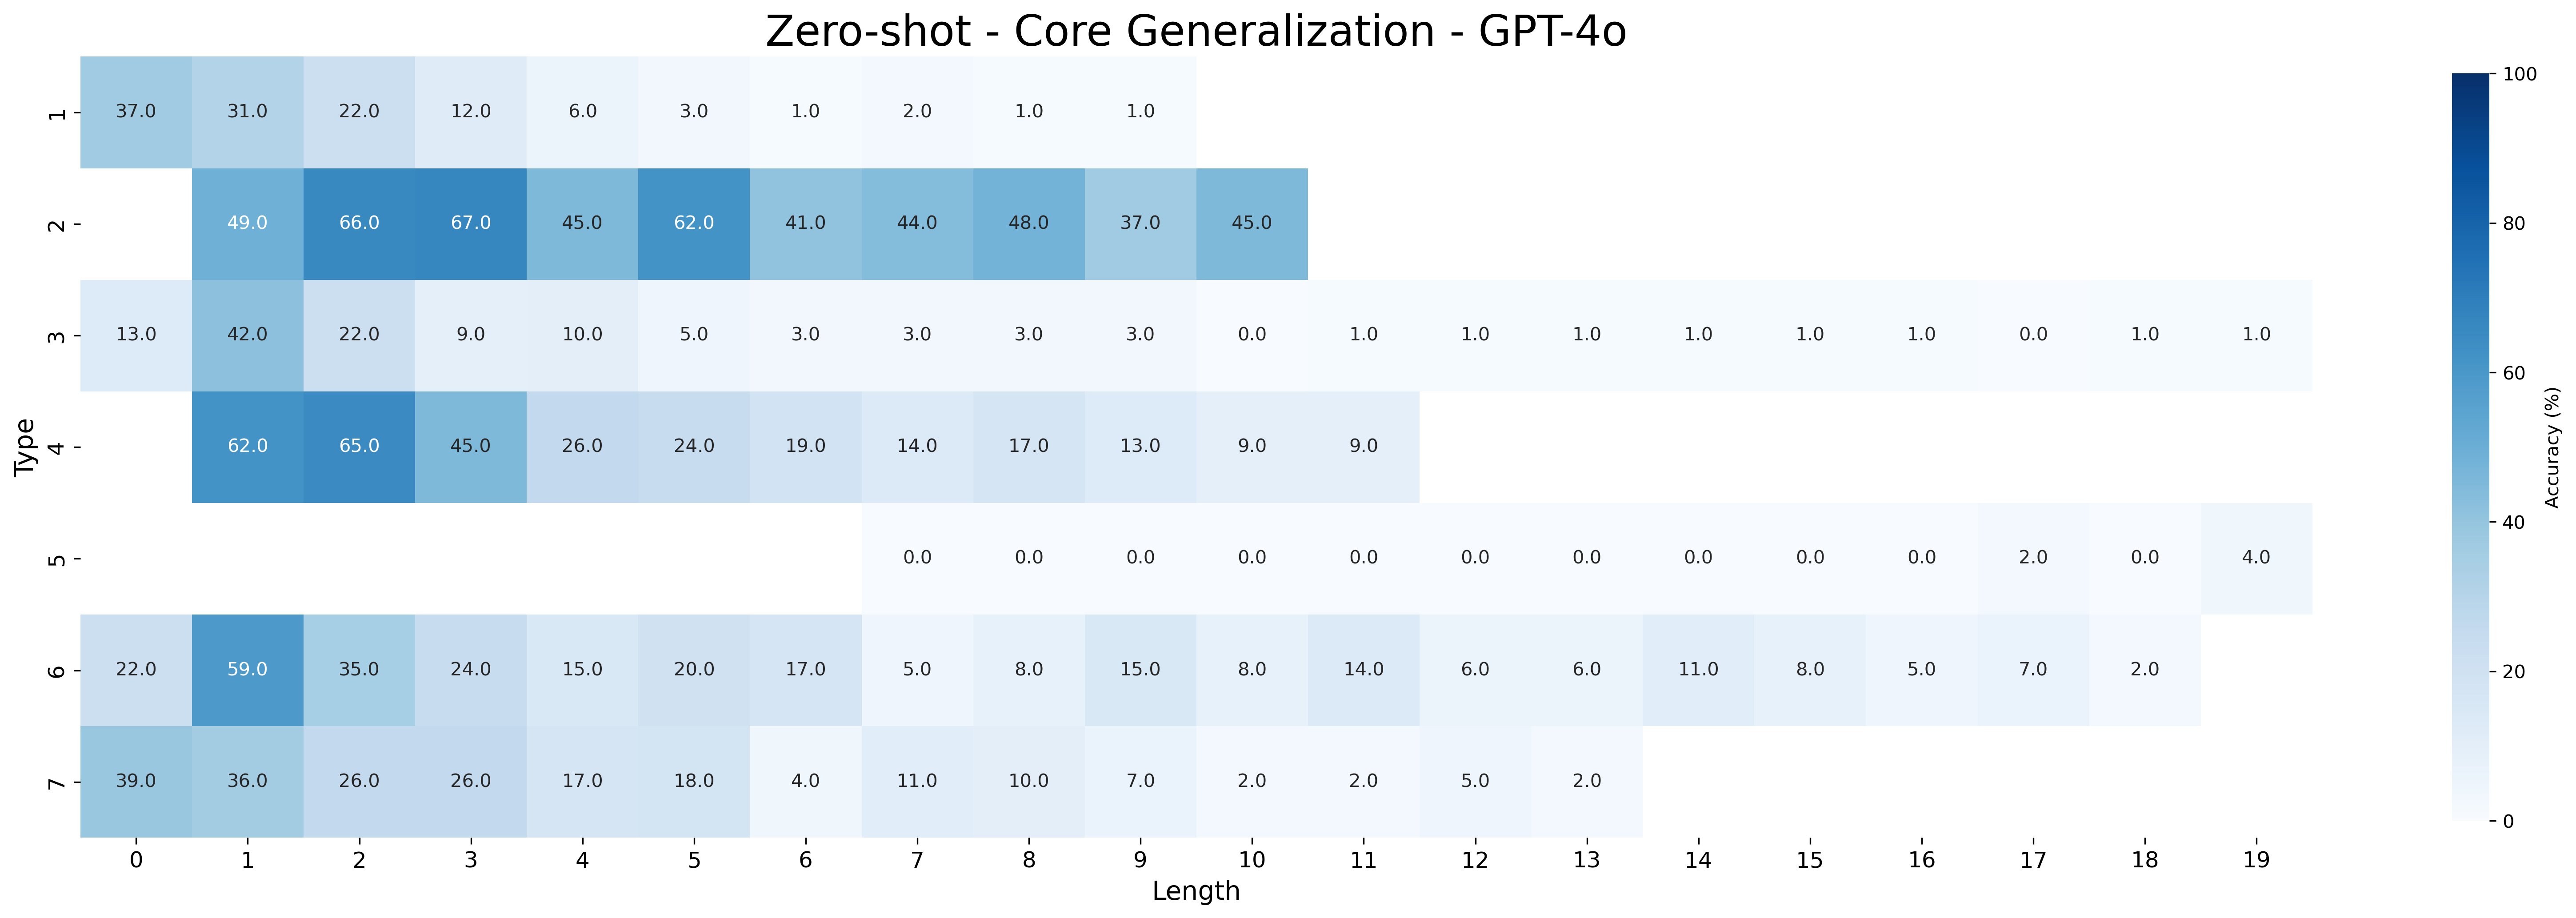
This image presents a heatmap visualizing the accuracy of GPT-4o across different 'Type' and 'Length' combinations. The heatmap uses a color gradient to represent accuracy percentages, ranging from approximately 0% (lightest shade) to 100% (darkest shade). The heatmap is structured as a grid, with 'Type' on the vertical axis and 'Length' on the horizontal axis.
### Components/Axes
* **Title:** "Zero-shot - Core Generalization - GPT-4o" (positioned at the top-center)
* **Vertical Axis (Type):** Labels are: "H", "Z", "M", "4", "U", "O", "7".
* **Horizontal Axis (Length):** Labels are integers from 0 to 19, representing length.
* **Color Scale:** A gradient scale on the right side indicates accuracy percentage, ranging from 0% (lightest color) to 100% (darkest color).
* **Data Cells:** Each cell in the grid represents the accuracy percentage for a specific 'Type' and 'Length' combination. The values are displayed within each cell.
### Detailed Analysis
The heatmap displays accuracy percentages for each combination of 'Type' and 'Length'. Here's a breakdown of the data, reading row by row:
* **Type H:**
* Length 0: 37.0%
* Length 1: 31.0%
* Length 2: 22.0%
* Length 3: 6.0%
* Length 4: 3.0%
* Length 5: 2.0%
* Length 6: 1.0%
* Length 7: 1.0%
* Length 8: 1.0%
* Length 9: 1.0%
* Length 10: 1.0%
* Length 11: 0.0%
* Length 12: 0.0%
* Length 13: 0.0%
* Length 14: 0.0%
* Length 15: 0.0%
* Length 16: 0.0%
* Length 17: 2.0%
* Length 18: 0.0%
* Length 19: 4.0%
* **Type Z:**
* Length 0: 49.0%
* Length 1: 66.0%
* Length 2: 67.0%
* Length 3: 45.0%
* Length 4: 62.0%
* Length 5: 44.0%
* Length 6: 48.0%
* Length 7: 37.0%
* Length 8: 45.0%
* **Type M:**
* Length 0: 42.0%
* Length 1: 22.0%
* Length 2: 9.0%
* Length 3: 10.0%
* Length 4: 5.0%
* Length 5: 3.0%
* Length 6: 3.0%
* Length 7: 3.0%
* Length 8: 1.0%
* Length 9: 1.0%
* Length 10: 1.0%
* Length 11: 1.0%
* Length 12: 1.0%
* Length 13: 1.0%
* Length 14: 1.0%
* Length 15: 1.0%
* Length 16: 1.0%
* Length 17: 1.0%
* Length 18: 1.0%
* Length 19: 1.0%
* **Type 4:**
* Length 0: 62.0%
* Length 1: 65.0%
* Length 2: 45.0%
* Length 3: 26.0%
* Length 4: 24.0%
* Length 5: 19.0%
* Length 6: 17.0%
* Length 7: 13.0%
* Length 8: 9.0%
* **Type U:**
* Length 0: 0.0%
* Length 1: 0.0%
* Length 2: 0.0%
* Length 3: 0.0%
* Length 4: 0.0%
* Length 5: 0.0%
* Length 6: 0.0%
* Length 7: 0.0%
* Length 8: 0.0%
* Length 9: 0.0%
* Length 10: 0.0%
* Length 11: 0.0%
* Length 12: 0.0%
* Length 13: 2.0%
* Length 14: 0.0%
* Length 15: 0.0%
* Length 16: 0.0%
* Length 17: 0.0%
* Length 18: 0.0%
* Length 19: 4.0%
* **Type O:**
* Length 0: 22.0%
* Length 1: 59.0%
* Length 2: 35.0%
* Length 3: 24.0%
* Length 4: 20.0%
* Length 5: 17.0%
* Length 6: 8.0%
* Length 7: 15.0%
* Length 8: 14.0%
* **Type 7:**
* Length 0: 39.0%
* Length 1: 36.0%
* Length 2: 26.0%
* Length 3: 17.0%
* Length 4: 18.0%
* Length 5: 11.0%
* Length 6: 10.0%
* Length 7: 2.0%
* Length 8: 5.0%
* Length 9: 2.0%
### Key Observations
* **Type Z** generally exhibits higher accuracy percentages, particularly at lengths 1 and 2, peaking at 67.0%.
* **Type U** consistently shows very low accuracy, often near 0%, across most lengths. A slight increase is observed at length 13 (2.0%) and 19 (4.0%).
* Accuracy tends to decrease as 'Length' increases for most 'Type' values.
* The highest accuracy value is 67.0% (Type Z, Length 2).
* The lowest accuracy value is 0.0% (Type U, Lengths 0-9).
### Interpretation
The heatmap demonstrates the performance of GPT-4o in a zero-shot core generalization setting, evaluating its accuracy across different input 'Types' and 'Lengths'. The significant variation in accuracy based on 'Type' suggests that the model performs better on certain types of tasks or inputs than others. The decline in accuracy with increasing 'Length' indicates a potential challenge in maintaining performance with longer inputs. The extremely low accuracy for 'Type U' suggests this type of input is particularly difficult for the model to handle in a zero-shot setting. This data could be used to identify areas where the model needs improvement, such as focusing on enhancing its performance on 'Type U' inputs or improving its ability to handle longer sequences. The heatmap provides a clear visual representation of the model's strengths and weaknesses, enabling targeted development efforts.