# Technical Document: Zero-shot - Core Generalization - GPT-4o Heatmap Analysis
## 1. Axis Labels and Titles
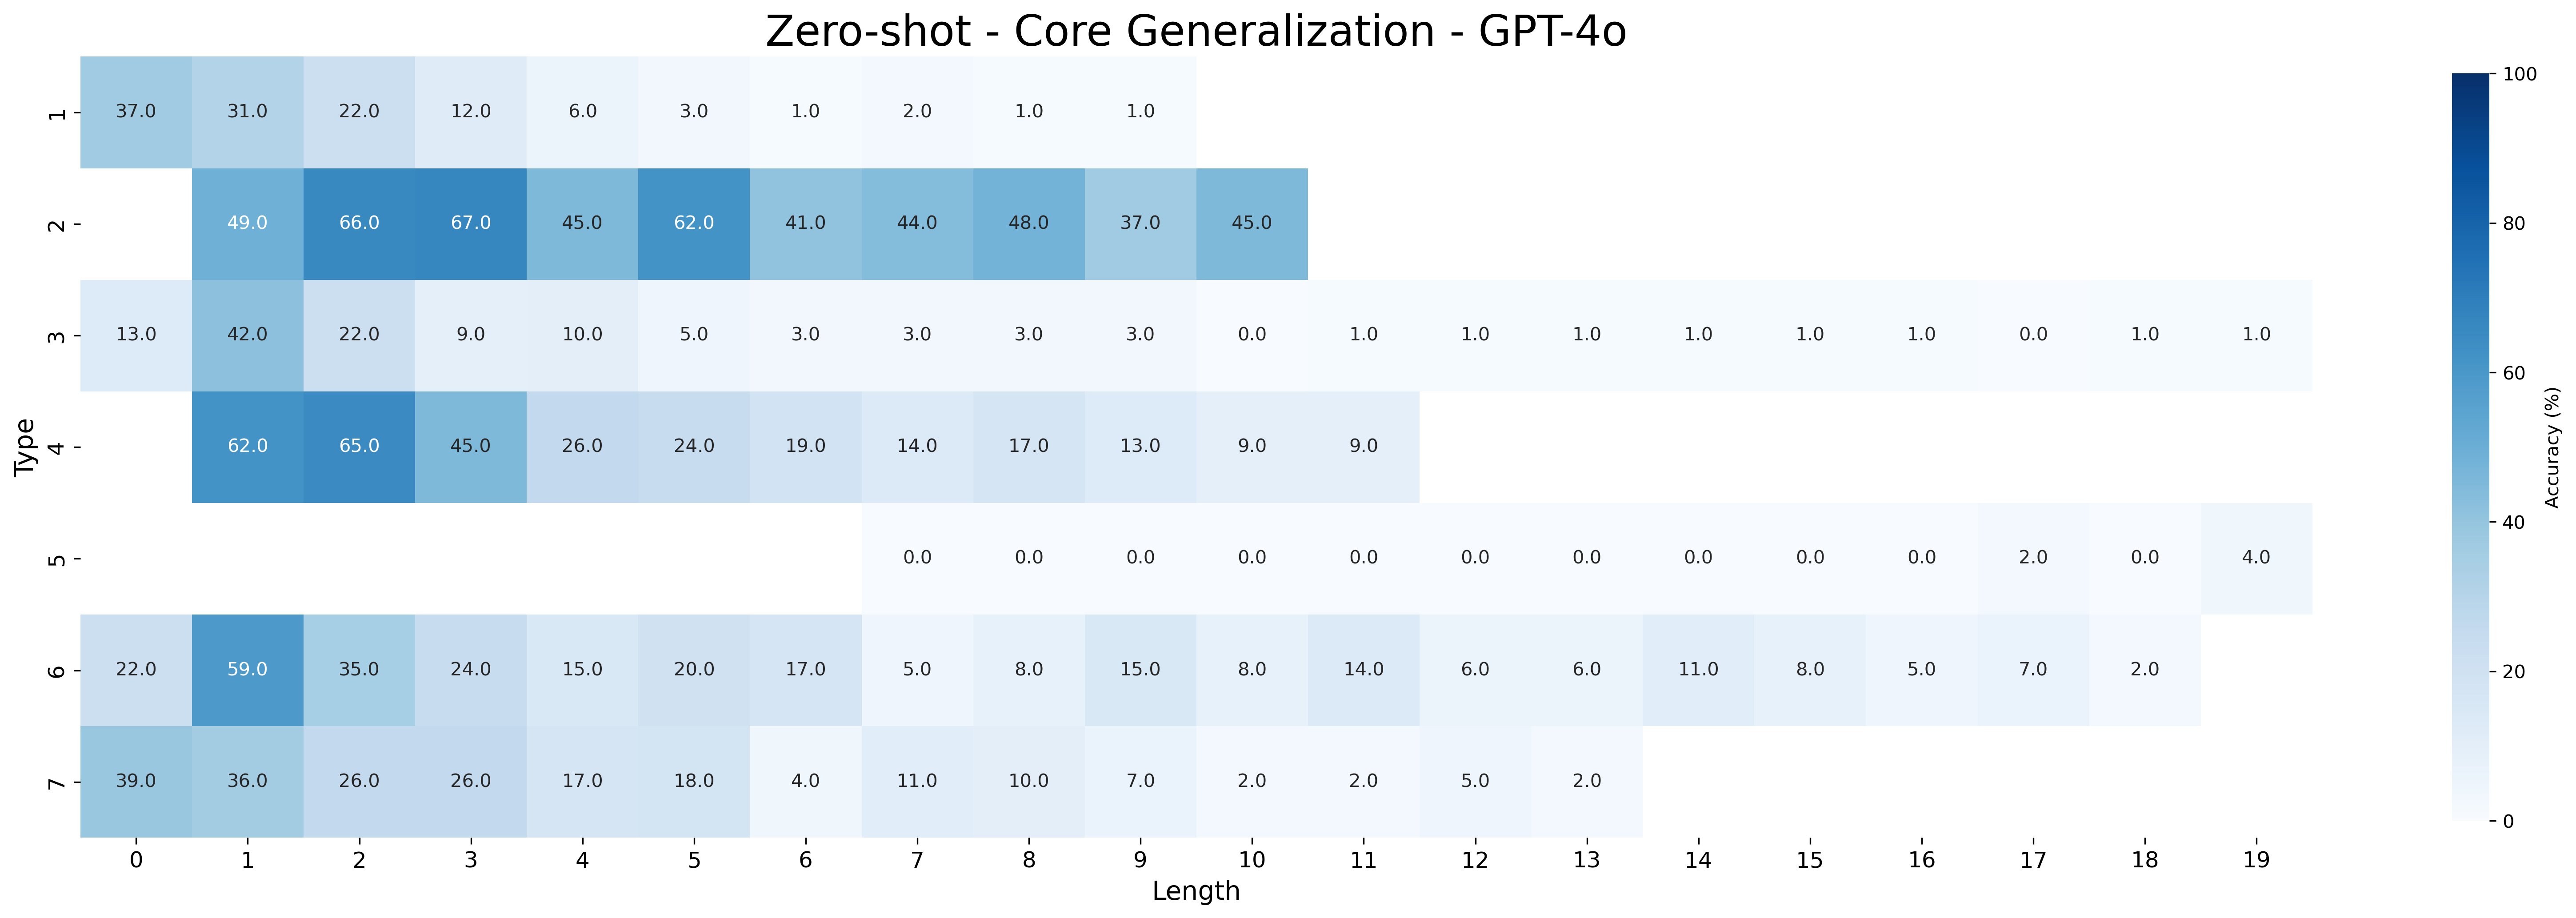
- **Title**: "Zero-shot - Core Generalization - GPT-4o" (centered at top)
- **X-axis**: "Length" (horizontal axis, values 0–19)
- **Y-axis**: "Type" (vertical axis, categories 1–7)
- **Colorbar**: "Accuracy (%)" (right side, gradient from 0% (light blue) to 100% (dark blue))
## 2. Categories and Sub-Categories
- **Y-axis Categories (Types)**:
- Type 1
- Type 2
- Type 3
- Type 4
- Type 5
- Type 6
- Type 7
- **X-axis Sub-Categories (Lengths)**:
- 0, 1, 2, 3, 4, 5, 6, 7, 8, 9, 10, 11, 12, 13, 14, 15, 16, 17, 18, 19
## 3. Data Table Reconstruction
| Type \ Length | 0 | 1 | 2 | 3 | 4 | 5 | 6 | 7 | 8 | 9 | 10 | 11 | 12 | 13 | 14 | 15 | 16 | 17 | 18 | 19 |
|---------------|------|------|------|------|------|------|------|------|------|------|------|------|------|------|------|------|------|------|------|------|
| **1** | 37.0 | 31.0 | 22.0 | 12.0 | 6.0 | 3.0 | 1.0 | 2.0 | 1.0 | 1.0 | | | | | | | | | | |
| **2** | | 49.0 | 66.0 | 67.0 | 45.0 | 62.0 | 41.0 | 44.0 | 48.0 | 37.0 | 45.0 | | | | | | | | | |
| **3** | 13.0 | 42.0 | 22.0 | 9.0 | 10.0 | 5.0 | 3.0 | 3.0 | 3.0 | 3.0 | 0.0 | 1.0 | 1.0 | 1.0 | 1.0 | 1.0 | 1.0 | 1.0 | 0.0 | 1.0 |
| **4** | 62.0 | 65.0 | 45.0 | 26.0 | 24.0 | 19.0 | 14.0 | 17.0 | 13.0 | 9.0 | | | | | | | | | | |
| **5** | | | | | | | | 0.0 | 0.0 | 0.0 | 0.0 | 0.0 | 0.0 | 0.0 | 0.0 | 0.0 | 0.0 | 2.0 | 0.0 | 4.0 |
| **6** | 22.0 | 59.0 | 35.0 | 24.0 | 15.0 | 20.0 | 17.0 | 5.0 | 8.0 | 15.0 | 8.0 | 14.0 | 6.0 | 6.0 | 11.0 | 8.0 | 5.0 | 7.0 | 2.0 | |
| **7** | 39.0 | 36.0 | 26.0 | 26.0 | 17.0 | 18.0 | 4.0 | 11.0 | 10.0 | 7.0 | 2.0 | 2.0 | 5.0 | 2.0 | | | | | | |
## 4. Key Trends and Observations
- **General Pattern**: Accuracy decreases as length increases for most types.
- **Type 2**:
- Highest accuracy at Length 1 (66%) and Length 3 (67%).
- Sharp decline after Length 3.
- **Type 5**:
- All zeros except Length 19 (4%).
- **Type 7**:
- Gradual decline from 39% (Length 0) to 2% (Length 13).
- **Color Consistency**:
- Darker blues (e.g., 66%, 67%) align with the colorbar's high-accuracy range.
- Light blues (e.g., 1%, 2%) match the low-accuracy range.
## 5. Spatial Grounding
- **Legend Position**: Colorbar on the right, vertical orientation.
- **Title Position**: Centered at the top of the chart.
- **Cell Placement**:
- Rows correspond to Types (1–7).
- Columns correspond to Lengths (0–19).
## 6. Component Isolation
- **Header**: Title and axis labels.
- **Main Chart**: Heatmap grid with numerical values.
- **Footer**: Colorbar with accuracy scale.
## 7. Transcribed Embedded Text
All numerical values in the heatmap cells are transcribed above. No non-English text detected.
## 8. Verification Notes
- All legend colors match the heatmap's color intensity.
- Trends (e.g., Type 2's peak at Length 3) align with numerical data.
- No omitted labels or axis markers.