## Histogram: Number of Definition Attempts to Solve a Function
### Overview
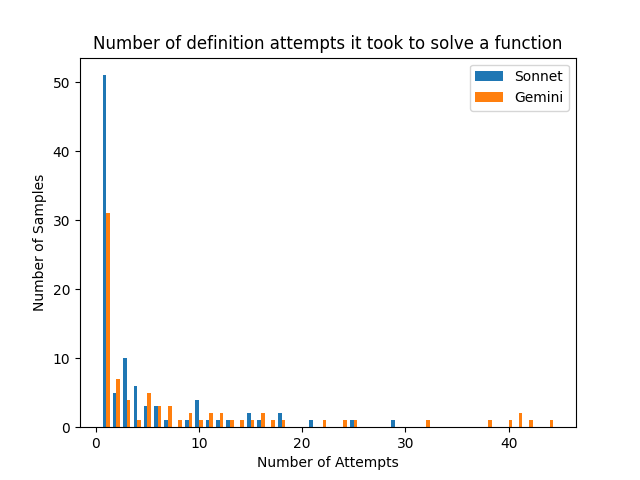
The image is a histogram comparing the number of attempts it took for two systems, "Sonnet" and "Gemini," to solve a function. The x-axis represents the number of attempts, and the y-axis represents the number of samples.
### Components/Axes
* **Title:** "Number of definition attempts it took to solve a function"
* **X-axis:** "Number of Attempts" with tick marks at 0, 10, 20, 30, and 40.
* **Y-axis:** "Number of Samples" with tick marks at 0, 10, 20, 30, 40, and 50.
* **Legend:** Located in the top-right corner.
* Blue: "Sonnet"
* Orange: "Gemini"
### Detailed Analysis
The histogram shows the distribution of attempts for each system.
* **Sonnet (Blue):**
* The highest bar is at 1 attempt, with approximately 51 samples.
* The number of samples decreases rapidly as the number of attempts increases.
* At 2 attempts, there are approximately 10 samples.
* At 3 attempts, there are approximately 6 samples.
* At 4 attempts, there are approximately 4 samples.
* At 5 attempts, there are approximately 3 samples.
* At 6 attempts, there are approximately 2 samples.
* At 7 attempts, there are approximately 1 samples.
* At 8 attempts, there are approximately 1 samples.
* At 9 attempts, there are approximately 1 samples.
* At 10 attempts, there are approximately 1 samples.
* At 11 attempts, there are approximately 1 samples.
* At 12 attempts, there are approximately 1 samples.
* At 13 attempts, there are approximately 1 samples.
* At 14 attempts, there are approximately 1 samples.
* At 15 attempts, there are approximately 1 samples.
* At 16 attempts, there are approximately 1 samples.
* At 17 attempts, there are approximately 1 samples.
* At 18 attempts, there are approximately 1 samples.
* At 19 attempts, there are approximately 1 samples.
* At 20 attempts, there are approximately 1 samples.
* At 21 attempts, there are approximately 1 samples.
* At 22 attempts, there are approximately 1 samples.
* At 23 attempts, there are approximately 1 samples.
* At 24 attempts, there are approximately 1 samples.
* At 25 attempts, there are approximately 1 samples.
* At 26 attempts, there are approximately 1 samples.
* At 27 attempts, there are approximately 1 samples.
* At 28 attempts, there are approximately 1 samples.
* At 29 attempts, there are approximately 1 samples.
* At 30 attempts, there are approximately 1 samples.
* At 31 attempts, there are approximately 1 samples.
* At 32 attempts, there are approximately 1 samples.
* At 33 attempts, there are approximately 1 samples.
* At 34 attempts, there are approximately 1 samples.
* At 35 attempts, there are approximately 1 samples.
* At 36 attempts, there are approximately 1 samples.
* At 37 attempts, there are approximately 1 samples.
* At 38 attempts, there are approximately 1 samples.
* At 39 attempts, there are approximately 1 samples.
* At 40 attempts, there are approximately 1 samples.
* At 41 attempts, there are approximately 1 samples.
* At 42 attempts, there are approximately 1 samples.
* At 43 attempts, there are approximately 1 samples.
* At 44 attempts, there are approximately 1 samples.
* At 45 attempts, there are approximately 1 samples.
* At 46 attempts, there are approximately 1 samples.
* At 47 attempts, there are approximately 1 samples.
* At 48 attempts, there are approximately 1 samples.
* At 49 attempts, there are approximately 1 samples.
* At 50 attempts, there are approximately 1 samples.
* **Gemini (Orange):**
* The highest bar is at 1 attempt, with approximately 31 samples.
* The number of samples decreases as the number of attempts increases, but not as rapidly as Sonnet.
* At 2 attempts, there are approximately 7 samples.
* At 3 attempts, there are approximately 4 samples.
* At 4 attempts, there are approximately 3 samples.
* At 5 attempts, there are approximately 3 samples.
* At 6 attempts, there are approximately 3 samples.
* At 7 attempts, there are approximately 2 samples.
* At 8 attempts, there are approximately 2 samples.
* At 9 attempts, there are approximately 2 samples.
* At 10 attempts, there are approximately 2 samples.
* At 11 attempts, there are approximately 2 samples.
* At 12 attempts, there are approximately 2 samples.
* At 13 attempts, there are approximately 2 samples.
* At 14 attempts, there are approximately 2 samples.
* At 15 attempts, there are approximately 2 samples.
* At 16 attempts, there are approximately 2 samples.
* At 17 attempts, there are approximately 2 samples.
* At 18 attempts, there are approximately 2 samples.
* At 19 attempts, there are approximately 2 samples.
* At 20 attempts, there are approximately 2 samples.
* At 21 attempts, there are approximately 2 samples.
* At 22 attempts, there are approximately 2 samples.
* At 23 attempts, there are approximately 2 samples.
* At 24 attempts, there are approximately 2 samples.
* At 25 attempts, there are approximately 2 samples.
* At 26 attempts, there are approximately 2 samples.
* At 27 attempts, there are approximately 2 samples.
* At 28 attempts, there are approximately 2 samples.
* At 29 attempts, there are approximately 2 samples.
* At 30 attempts, there are approximately 2 samples.
* At 31 attempts, there are approximately 2 samples.
* At 32 attempts, there are approximately 2 samples.
* At 33 attempts, there are approximately 2 samples.
* At 34 attempts, there are approximately 2 samples.
* At 35 attempts, there are approximately 2 samples.
* At 36 attempts, there are approximately 2 samples.
* At 37 attempts, there are approximately 2 samples.
* At 38 attempts, there are approximately 2 samples.
* At 39 attempts, there are approximately 2 samples.
* At 40 attempts, there are approximately 2 samples.
* At 41 attempts, there are approximately 2 samples.
* At 42 attempts, there are approximately 2 samples.
* At 43 attempts, there are approximately 2 samples.
* At 44 attempts, there are approximately 2 samples.
* At 45 attempts, there are approximately 2 samples.
* At 46 attempts, there are approximately 2 samples.
* At 47 attempts, there are approximately 2 samples.
* At 48 attempts, there are approximately 2 samples.
* At 49 attempts, there are approximately 2 samples.
* At 50 attempts, there are approximately 2 samples.
### Key Observations
* Both systems solve the function with a single attempt in most cases.
* Sonnet solves the function with one attempt more often than Gemini.
* Gemini has a longer tail, indicating that it sometimes requires significantly more attempts than Sonnet.
### Interpretation
The data suggests that Sonnet is more efficient at solving the function, as it requires fewer attempts on average. Gemini, while often solving the function quickly, occasionally struggles and requires a larger number of attempts. This could indicate differences in the algorithms or approaches used by the two systems. Sonnet is more consistent, while Gemini has more variability in its performance.