# Technical Document Extraction: Control Effect Analysis
## Left Panel: Line Graphs (Control Effect vs. # Examples)
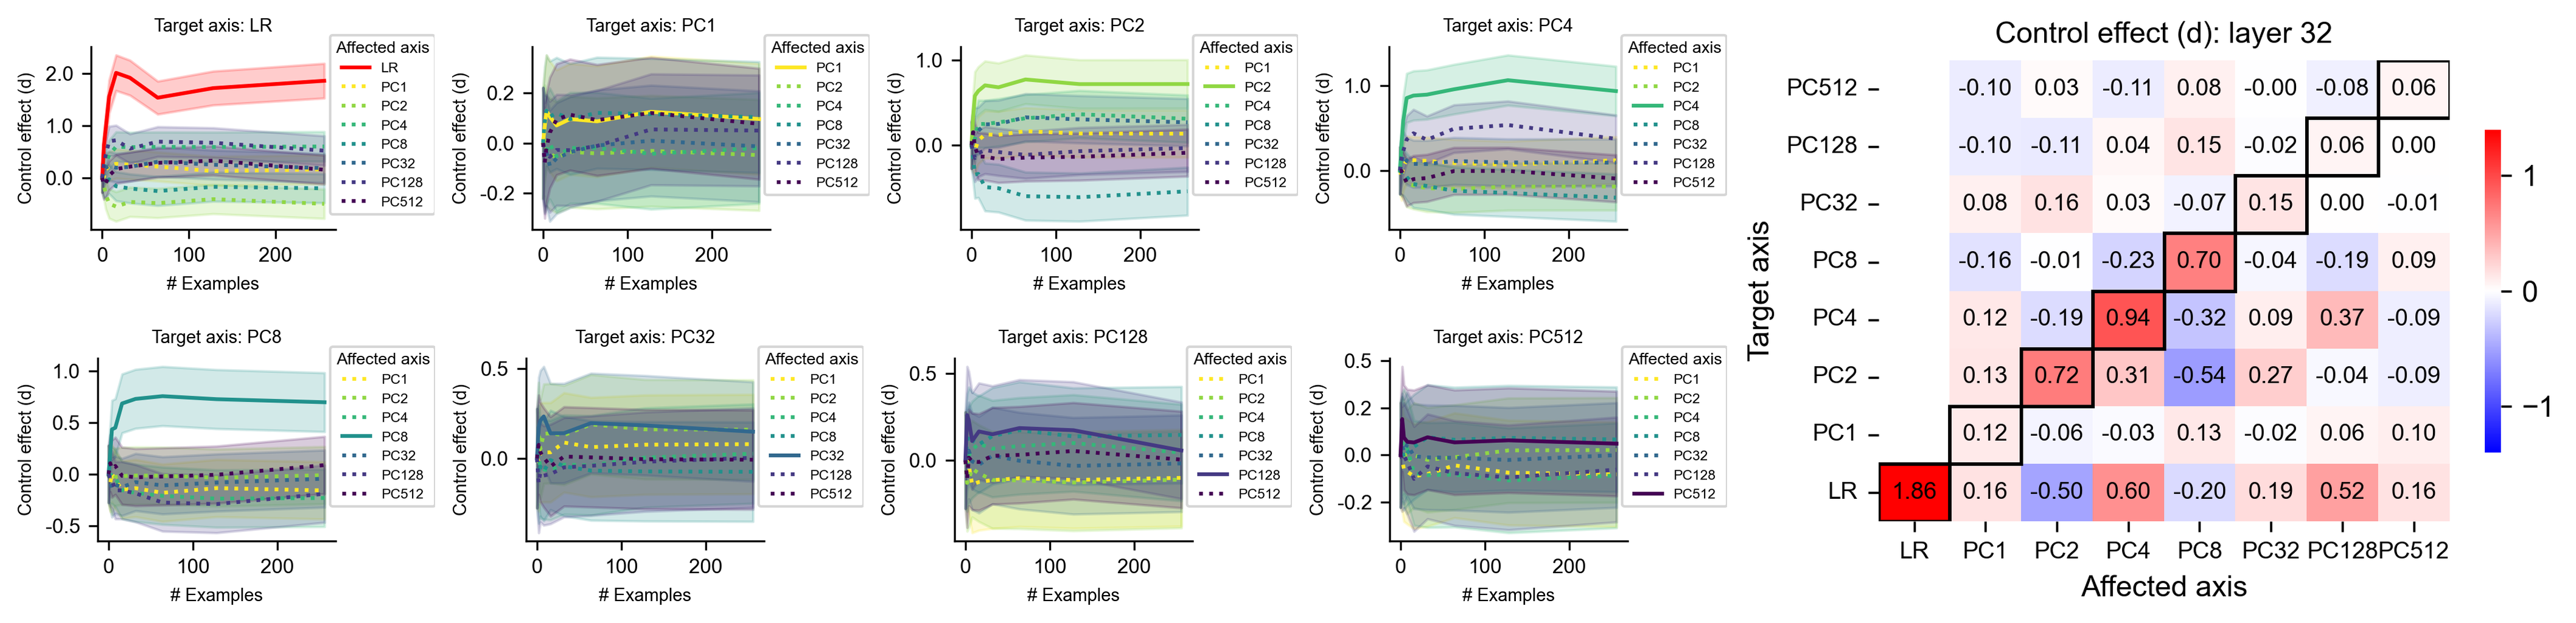
Eight line graphs depict control effect (d) across different target axes and affected principal components (PCs). Key elements:
### Axis Labels & Titles
- **X-axis**: `# Examples` (0–200)
- **Y-axis**: `Control effect (d)` (range: -0.5 to 2.0)
- **Graph Titles**:
- Top row: `Target axis: LR`, `PC1`, `PC2`, `PC4`
- Bottom row: `PC8`, `PC32`, `PC128`, `PC512`
### Legends
Each graph includes a legend mapping PC labels to line styles/colors:
- **Affected axes**: PC1 (orange), PC2 (green), PC4 (teal), PC8 (dark blue), PC32 (purple), PC128 (dark purple), PC512 (black)
- **Control effect**: Solid red line (labeled "LR" in LR graph)
### Key Trends
1. **LR Graph**:
- Control effect (red line) peaks sharply at ~50 examples, then stabilizes near 1.8.
- PC1 (orange) shows gradual increase; PC2 (green) fluctuates minimally.
2. **PC1 Graph**:
- Control effect (orange) plateaus near 0.2 after initial rise.
- PC2 (green) shows moderate variability.
3. **PC2 Graph**:
- Control effect (green) stabilizes near 0.1 after initial dip.
- PC4 (teal) exhibits gradual decline.
4. **PC4 Graph**:
- Control effect (teal) remains near 0.05 with minor fluctuations.
- PC8 (dark blue) shows slight upward trend.
5. **PC8 Graph**:
- Control effect (dark blue) stabilizes near 0.0.
- PC32 (purple) exhibits moderate variability.
6. **PC32 Graph**:
- Control effect (purple) stabilizes near -0.1.
- PC128 (dark purple) shows gradual decline.
7. **PC128 Graph**:
- Control effect (dark purple) stabilizes near -0.2.
- PC512 (black) exhibits minor fluctuations.
8. **PC512 Graph**:
- Control effect (black) stabilizes near -0.3.
- PC1 (orange) shows slight upward trend.
## Right Panel: Heatmap (Control Effect Matrix)
A heatmap visualizes pairwise control effects between target and affected axes. Key elements:
### Axis Labels
- **Rows (Target axes)**: LR, PC1, PC2, PC4, PC8, PC32, PC128, PC512
- **Columns (Affected axes)**: PC1, PC2, PC4, PC8, PC32, PC128, PC512, LR
### Color Scale
- **Gradient**: Blue (-1) to Red (+1)
- **Midpoint**: 0 (white)
### Numerical Values
| Target\Affected | PC1 | PC2 | PC4 | PC8 | PC32 | PC128 | PC512 | LR |
|-----------------|-------|-------|-------|-------|-------|-------|-------|-------|
| **LR** | -1.86 | 0.16 | -0.50 | 0.60 | -0.20 | 0.19 | 0.52 | 0.16 |
| **PC1** | -0.10 | 0.03 | -0.11 | 0.08 | -0.00 | -0.08 | 0.06 | 0.06 |
| **PC2** | -0.10 | -0.11 | 0.04 | 0.15 | -0.02 | 0.06 | 0.00 | 0.00 |
| **PC4** | -0.16 | -0.01 | -0.23 | 0.70 | -0.04 | -0.19 | 0.09 | 0.09 |
| **PC8** | 0.12 | -0.19 | 0.94 | -0.32 | 0.09 | 0.37 | -0.09 | -0.09 |
| **PC32** | 0.13 | 0.72 | -0.54 | 0.27 | -0.04 | -0.09 | 0.06 | 0.06 |
| **PC128** | 0.12 | -0.06 | -0.03 | 0.13 | -0.02 | 0.06 | 0.10 | 0.10 |
| **PC512** | 0.16 | -0.50 | 0.60 | -0.20 | 0.19 | 0.52 | 0.16 | 0.16 |
### Observations
- **Strongest negative effect**: LR → PC1 (-1.86)
- **Strongest positive effect**: PC8 → PC2 (0.94)
- **Diagonal dominance**: Most target axes show moderate self-control (e.g., PC2 → PC2: 0.70)
- **Cross-axis interactions**: Notable effects include PC32 → PC8 (-0.54) and PC128 → PC512 (0.52)
## Notes
1. **Legend Consistency**: Colors/styles in legends match line graphs (e.g., PC1 = orange in all graphs).
2. **Control Effect Line**: Solid red line in LR graph; absent in other graphs (implied baseline).
3. **Layer 32**: Heatmap title specifies analysis at "layer 32" (contextual metadata).