\n
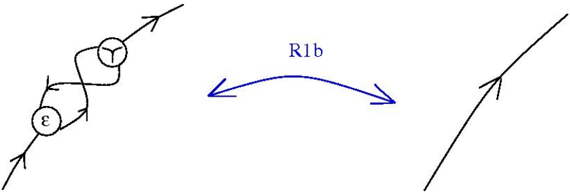
## Diagram: System State Transition
### Overview
The image depicts a diagram illustrating a system state transition. It shows a complex state on the left, a transition arrow in the center, and a simpler state on the right. The diagram appears to represent a simplification or reduction of complexity within a system.
### Components/Axes
The diagram consists of the following components:
* **Left State:** A complex state represented by a series of interconnected lines and two circular nodes. The top node contains the symbol "Y", and the bottom node contains the symbol "ε" (epsilon).
* **Transition Arrow:** A curved, blue arrow pointing from the left state to the right state. The arrow is labeled "R1b".
* **Right State:** A simple state represented by a straight line with arrowheads at both ends.
### Detailed Analysis or Content Details
The left state is characterized by its intricate structure. The lines connecting the nodes and forming loops suggest internal interactions and dependencies. The presence of the symbols "Y" and "ε" within the nodes likely represents specific variables or parameters within the system.
The transition arrow "R1b" indicates a transformation or simplification process. The arrow's curvature suggests a non-linear or complex relationship between the initial and final states.
The right state is a simple linear representation, indicating a reduction in complexity. The arrowheads at both ends suggest a continuous flow or a stable state.
### Key Observations
The diagram highlights a clear transition from a complex, interconnected state to a simpler, linear state. The label "R1b" suggests a specific rule or operation governing this transition. The symbols "Y" and "ε" within the left state may represent key variables or parameters that are either eliminated or simplified during the transition.
### Interpretation
This diagram likely represents a simplification or reduction of a complex system. The left state could represent a system with multiple interacting components, while the right state represents a simplified model or approximation. The transition "R1b" could represent a mathematical operation, a physical process, or a logical rule that transforms the complex state into a simpler one.
The use of symbols "Y" and "ε" suggests a mathematical or scientific context. "ε" is often used to represent a small quantity or an error term, while "Y" could represent a variable or output. The diagram could be illustrating a process of approximation, where the complex system is reduced to a simpler model by neglecting certain terms or interactions.
The diagram's simplicity suggests it is intended to convey a high-level understanding of the system's behavior, rather than a detailed technical specification. It could be used to illustrate a concept in a textbook, a presentation, or a research paper. The diagram is not providing any numerical data, but rather a conceptual representation of a system's state transition.