## Line Chart: Llama-3.2 Model Performance
### Overview
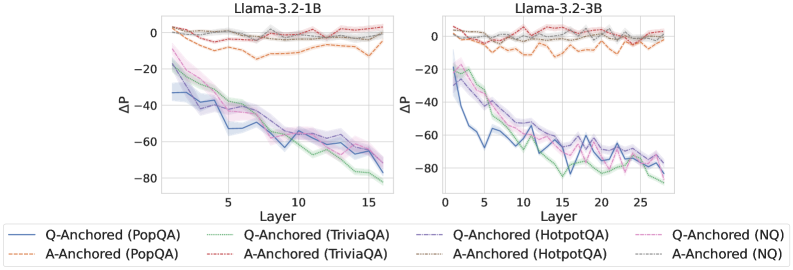
The image contains two line charts comparing the performance of Llama-3.2 models (1B and 3B) across different question-answering datasets. The charts plot the change in performance (ΔP) against the layer number of the model. Each chart displays six data series, representing question-anchored (Q-Anchored) and answer-anchored (A-Anchored) performance on PopQA, TriviaQA, HotpotQA, and NQ datasets.
### Components/Axes
**Left Chart (Llama-3.2-1B):**
* **Title:** Llama-3.2-1B
* **X-axis:** Layer, with markers at 0, 5, 10, and 15.
* **Y-axis:** ΔP, with markers at 0, -20, -40, -60, and -80.
* **Legend:** Located below the chart.
* Q-Anchored (PopQA): Solid Blue Line
* A-Anchored (PopQA): Dashed Brown Line
* Q-Anchored (TriviaQA): Dotted Green Line
* A-Anchored (TriviaQA): Dash-Dotted Pink Line
* Q-Anchored (HotpotQA): Dash-Dot Blue Line
* Q-Anchored (NQ): Dotted Pink Line
* A-Anchored (HotpotQA): Solid Green Line
* A-Anchored (NQ): Dotted Grey Line
**Right Chart (Llama-3.2-3B):**
* **Title:** Llama-3.2-3B
* **X-axis:** Layer, with markers at 0, 5, 10, 15, 20, and 25.
* **Y-axis:** ΔP, with markers at 0, -20, -40, -60, and -80.
* **Legend:** Located below both charts.
* Q-Anchored (PopQA): Solid Blue Line
* A-Anchored (PopQA): Dashed Brown Line
* Q-Anchored (TriviaQA): Dotted Green Line
* A-Anchored (TriviaQA): Dash-Dotted Pink Line
* Q-Anchored (HotpotQA): Dash-Dot Blue Line
* Q-Anchored (NQ): Dotted Pink Line
* A-Anchored (HotpotQA): Solid Green Line
* A-Anchored (NQ): Dotted Grey Line
### Detailed Analysis
**Llama-3.2-1B Chart:**
* **Q-Anchored (PopQA):** (Solid Blue Line) Starts at approximately -30 and generally decreases to around -70 by layer 15.
* **A-Anchored (PopQA):** (Dashed Brown Line) Remains relatively flat, fluctuating between 0 and -10.
* **Q-Anchored (TriviaQA):** (Dotted Green Line) Starts at approximately -30 and decreases to around -60 by layer 15.
* **A-Anchored (TriviaQA):** (Dash-Dotted Pink Line) Remains relatively flat, fluctuating between 0 and -10.
* **Q-Anchored (HotpotQA):** (Dash-Dot Blue Line) Starts at approximately -20 and decreases to around -60 by layer 15.
* **Q-Anchored (NQ):** (Dotted Pink Line) Starts at approximately -20 and decreases to around -50 by layer 15.
* **A-Anchored (HotpotQA):** (Solid Green Line) Starts at approximately -30 and decreases to around -70 by layer 15.
* **A-Anchored (NQ):** (Dotted Grey Line) Remains relatively flat, fluctuating between 0 and -10.
**Llama-3.2-3B Chart:**
* **Q-Anchored (PopQA):** (Solid Blue Line) Starts at approximately -30 and generally decreases to around -70 by layer 25.
* **A-Anchored (PopQA):** (Dashed Brown Line) Remains relatively flat, fluctuating between 0 and -10.
* **Q-Anchored (TriviaQA):** (Dotted Green Line) Starts at approximately -30 and decreases to around -70 by layer 25.
* **A-Anchored (TriviaQA):** (Dash-Dotted Pink Line) Remains relatively flat, fluctuating between 0 and -10.
* **Q-Anchored (HotpotQA):** (Dash-Dot Blue Line) Starts at approximately -30 and decreases to around -70 by layer 25.
* **Q-Anchored (NQ):** (Dotted Pink Line) Starts at approximately -20 and decreases to around -70 by layer 25.
* **A-Anchored (HotpotQA):** (Solid Green Line) Starts at approximately -30 and decreases to around -70 by layer 25.
* **A-Anchored (NQ):** (Dotted Grey Line) Remains relatively flat, fluctuating between 0 and -10.
### Key Observations
* The Q-Anchored lines (PopQA, TriviaQA, HotpotQA, and NQ) generally show a decreasing trend in ΔP as the layer number increases for both models.
* The A-Anchored lines (PopQA, TriviaQA, HotpotQA, and NQ) remain relatively flat across all layers for both models.
* The 3B model has more layers (25) than the 1B model (15).
* The performance drop (ΔP) is more pronounced for Q-Anchored data compared to A-Anchored data.
### Interpretation
The charts suggest that question anchoring has a more significant impact on performance as the model processes deeper layers. The decreasing ΔP for Q-Anchored data indicates that the model's performance degrades more noticeably with increasing layer depth when the question is the anchor. Conversely, answer anchoring seems to maintain a more stable performance across different layers. The 3B model, with its increased number of layers, exhibits similar trends to the 1B model, but the performance drop in Q-Anchored data is sustained over a larger number of layers. This could imply that the deeper layers in the 3B model are more sensitive to question-related information. The flat A-Anchored lines suggest that the model's performance is less affected by the layer depth when the answer is the anchor.