## Chart: ΔP vs. Layer for Llama Models
### Overview
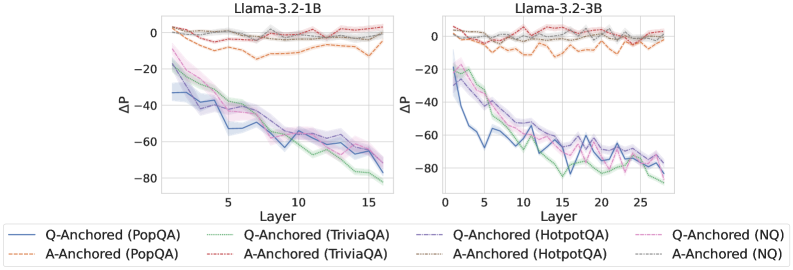
The image presents two line charts comparing the change in probability (ΔP) across layers for two Llama models: Llama-3.2-1B and Llama-3.2-3B. The charts display ΔP as a function of layer number, with different lines representing different anchoring methods and question-answering datasets.
### Components/Axes
* **X-axis:** Layer (ranging from approximately 0 to 15 for the 1B model and 0 to 25 for the 3B model).
* **Y-axis:** ΔP (ranging from approximately -80 to 0).
* **Models:** Llama-3.2-1B (left chart), Llama-3.2-3B (right chart).
* **Anchoring Methods:** Q-Anchored, A-Anchored.
* **Question-Answering Datasets:** PopQA, TriviaQA, HotpotQA, NQ.
* **Legend:** Located at the bottom of the image, with color-coded lines corresponding to each combination of anchoring method and dataset.
### Detailed Analysis
**Llama-3.2-1B (Left Chart)**
* **Q-Anchored (PopQA):** (Blue line) Starts at approximately -2, decreases steadily to approximately -70 at layer 15.
* **A-Anchored (PopQA):** (Orange dashed line) Starts at approximately -1, decreases to approximately -50 at layer 15.
* **Q-Anchored (TriviaQA):** (Green line) Starts at approximately -5, decreases to approximately -60 at layer 15.
* **A-Anchored (TriviaQA):** (Purple line) Starts at approximately -3, decreases to approximately -55 at layer 15.
* **Q-Anchored (HotpotQA):** (Light Blue line) Starts at approximately -1, decreases to approximately -65 at layer 15.
* **A-Anchored (HotpotQA):** (Yellow line) Starts at approximately -2, decreases to approximately -55 at layer 15.
* **Q-Anchored (NQ):** (Pink line) Starts at approximately -2, decreases to approximately -60 at layer 15.
* **A-Anchored (NQ):** (Grey line) Starts at approximately -1, decreases to approximately -50 at layer 15.
**Llama-3.2-3B (Right Chart)**
* **Q-Anchored (PopQA):** (Blue line) Starts at approximately -2, decreases to approximately -70 at layer 25.
* **A-Anchored (PopQA):** (Orange dashed line) Starts at approximately -1, decreases to approximately -50 at layer 25.
* **Q-Anchored (TriviaQA):** (Green line) Starts at approximately -5, decreases to approximately -60 at layer 25.
* **A-Anchored (TriviaQA):** (Purple line) Starts at approximately -3, decreases to approximately -55 at layer 25.
* **Q-Anchored (HotpotQA):** (Light Blue line) Starts at approximately -1, decreases to approximately -65 at layer 25.
* **A-Anchored (HotpotQA):** (Yellow line) Starts at approximately -2, decreases to approximately -55 at layer 25.
* **Q-Anchored (NQ):** (Pink line) Starts at approximately -2, decreases to approximately -60 at layer 25.
* **A-Anchored (NQ):** (Grey line) Starts at approximately -1, decreases to approximately -50 at layer 25.
In both charts, all lines generally exhibit a downward trend, indicating a decrease in ΔP as the layer number increases. The Q-Anchored lines consistently show a steeper decline than the A-Anchored lines for all datasets.
### Key Observations
* The 3B model (right chart) extends to a higher layer number (25) compared to the 1B model (15).
* The Q-Anchored method consistently results in a larger negative ΔP compared to the A-Anchored method across all datasets and models.
* The PopQA dataset generally shows the lowest ΔP values for both anchoring methods.
* The lines representing different datasets are relatively close to each other within each anchoring method, suggesting that the anchoring method has a more significant impact on ΔP than the specific dataset.
### Interpretation
The charts demonstrate how the change in probability (ΔP) evolves across layers in the Llama models, influenced by the anchoring method and the question-answering dataset used. The consistent downward trend suggests that the models' internal representations become more specialized or refined as information propagates through deeper layers.
The steeper decline observed with Q-Anchoring indicates that anchoring the query representation has a stronger effect on reducing the probability difference compared to anchoring the answer representation. This could imply that the query representation is more crucial for capturing the relevant information for accurate question answering.
The differences in ΔP values across datasets suggest that the models perform differently depending on the complexity or characteristics of the questions. PopQA, showing the lowest ΔP, might represent a more challenging dataset for the models.
The overall pattern suggests that the models are learning to differentiate between correct and incorrect answers as they process information through deeper layers, and the anchoring method plays a critical role in shaping this learning process. The fact that the trends are similar for both model sizes suggests that the underlying mechanisms are consistent, even as the model capacity increases.