## Line Graph: ΔP vs. Layer for Llama-3.2-1B and Llama-3.2-3B Models
### Overview
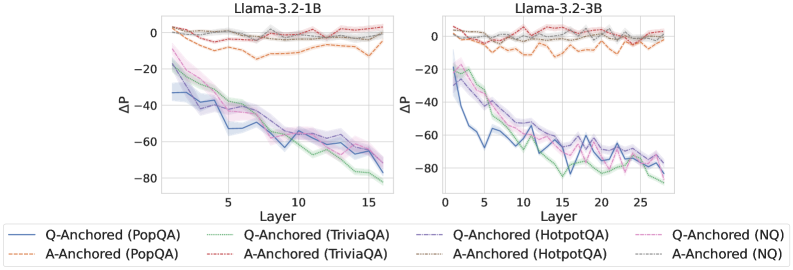
The image contains two side-by-side line graphs comparing the performance of Q-Anchored and A-Anchored models across layers for two versions of the Llama-3.2 architecture (1B and 3B parameters). The y-axis represents ΔP (change in performance), and the x-axis represents the layer number. Each graph includes multiple data series differentiated by color, line style, and legend labels.
---
### Components/Axes
- **X-axis (Layer)**:
- Llama-3.2-1B: 0 to 15 (increments of 5)
- Llama-3.2-3B: 0 to 25 (increments of 5)
- **Y-axis (ΔP)**:
- Range: -80 to 0 (increments of 20)
- **Legend**:
- Positioned at the bottom of both graphs.
- Labels include:
- **Q-Anchored (PopQA)**: Blue solid line
- **A-Anchored (PopQA)**: Orange dashed line
- **Q-Anchored (TriviaQA)**: Green solid line
- **A-Anchored (TriviaQA)**: Red dashed line
- **Q-Anchored (HotpotQA)**: Purple solid line
- **A-Anchored (HotpotQA)**: Gray dashed line
- **Q-Anchored (NQ)**: Pink solid line
- **A-Anchored (NQ)**: Black dashed line
---
### Detailed Analysis
#### Llama-3.2-1B Graph
- **Q-Anchored (PopQA)**: Starts at ~-20 (Layer 0), decreases to ~-60 (Layer 15). Trend: Steady decline.
- **A-Anchored (PopQA)**: Starts at ~0 (Layer 0), decreases to ~-20 (Layer 15). Trend: Gradual decline.
- **Q-Anchored (TriviaQA)**: Starts at ~-40 (Layer 0), decreases to ~-80 (Layer 15). Trend: Sharp decline.
- **A-Anchored (TriviaQA)**: Starts at ~-20 (Layer 0), decreases to ~-60 (Layer 15). Trend: Moderate decline.
- **Q-Anchored (HotpotQA)**: Starts at ~-60 (Layer 0), decreases to ~-80 (Layer 15). Trend: Slight decline.
- **A-Anchored (HotpotQA)**: Starts at ~-40 (Layer 0), decreases to ~-60 (Layer 15). Trend: Steady decline.
- **Q-Anchored (NQ)**: Starts at ~-80 (Layer 0), decreases to ~-100 (Layer 15). Trend: Sharp decline.
- **A-Anchored (NQ)**: Starts at ~-60 (Layer 0), decreases to ~-80 (Layer 15). Trend: Moderate decline.
#### Llama-3.2-3B Graph
- **Q-Anchored (PopQA)**: Starts at ~-10 (Layer 0), decreases to ~-50 (Layer 25). Trend: Steady decline.
- **A-Anchored (PopQA)**: Starts at ~0 (Layer 0), decreases to ~-20 (Layer 25). Trend: Gradual decline.
- **Q-Anchored (TriviaQA)**: Starts at ~-30 (Layer 0), decreases to ~-70 (Layer 25). Trend: Sharp decline.
- **A-Anchored (TriviaQA)**: Starts at ~-10 (Layer 0), decreases to ~-50 (Layer 25). Trend: Moderate decline.
- **Q-Anchored (HotpotQA)**: Starts at ~-50 (Layer 0), decreases to ~-70 (Layer 25). Trend: Slight decline.
- **A-Anchored (HotpotQA)**: Starts at ~-30 (Layer 0), decreases to ~-50 (Layer 25). Trend: Steady decline.
- **Q-Anchored (NQ)**: Starts at ~-70 (Layer 0), decreases to ~-90 (Layer 25). Trend: Sharp decline.
- **A-Anchored (NQ)**: Starts at ~-50 (Layer 0), decreases to ~-70 (Layer 25). Trend: Moderate decline.
---
### Key Observations
1. **General Trend**: All data series show a downward trend in ΔP as layer number increases, indicating performance degradation with deeper layers.
2. **Model Size Impact**:
- Llama-3.2-3B (larger model) exhibits less severe ΔP declines compared to Llama-3.2-1B, suggesting better layer-wise performance in larger models.
3. **Dataset-Specific Patterns**:
- **NQ (Natural Questions)**: Shows the steepest declines, indicating higher sensitivity to layer depth.
- **PopQA**: Exhibits the least severe declines, suggesting it is less affected by layer depth.
4. **Q-Anchored vs. A-Anchored**:
- Q-Anchored models consistently show lower ΔP values than A-Anchored models across all datasets, implying better performance stability.
---
### Interpretation
The data suggests that Q-Anchored models (e.g., PopQA, TriviaQA, HotpotQA, NQ) generally outperform A-Anchored models in terms of ΔP across layers. This could indicate that Q-Anchored architectures are more effective at maintaining performance in deeper layers. The larger Llama-3.2-3B model demonstrates improved layer-wise stability compared to the smaller 1B version, highlighting the benefits of increased model size. The NQ dataset’s pronounced declines suggest it is more challenging for the models, while PopQA’s minimal changes imply it is easier to handle. These trends may reflect differences in dataset complexity or model architecture design.