## Line Chart: Sentence Probability vs. Sentence Index
### Overview
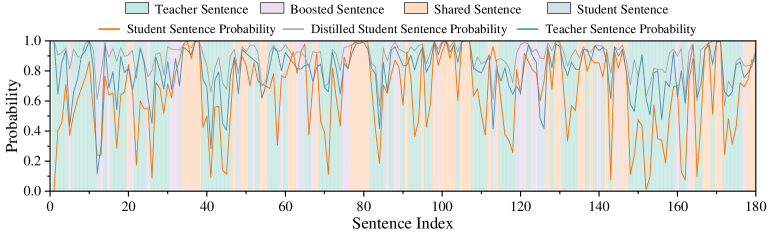
The image is a line chart that plots the probability of different types of sentences (Student, Teacher, Distilled Student) against the sentence index. The chart also uses colored vertical bands to indicate the type of sentence (Teacher, Boosted, Shared, Student).
### Components/Axes
* **X-axis:** Sentence Index, ranging from 0 to 180 in increments of 20.
* **Y-axis:** Probability, ranging from 0.0 to 1.0 in increments of 0.2.
* **Legend (top-left):**
* Teacher Sentence (light teal)
* Boosted Sentence (light purple)
* Shared Sentence (light orange)
* Student Sentence (light gray-blue)
* Student Sentence Probability (orange line)
* Distilled Student Sentence Probability (gray line)
* Teacher Sentence Probability (blue line)
### Detailed Analysis
* **Student Sentence Probability (orange line):** This line fluctuates significantly across the sentence index, ranging from approximately 0.0 to 1.0.
* **Distilled Student Sentence Probability (gray line):** This line also fluctuates, but generally stays between 0.6 and 1.0.
* **Teacher Sentence Probability (blue line):** This line fluctuates, generally staying between 0.6 and 1.0.
* **Colored Bands:** The vertical bands indicate the type of sentence at each index.
* Teacher Sentence (light teal)
* Boosted Sentence (light purple)
* Shared Sentence (light orange)
* Student Sentence (light gray-blue)
### Key Observations
* The Student Sentence Probability (orange line) has more frequent and deeper drops compared to the Teacher and Distilled Student Sentence Probabilities.
* The Teacher Sentence Probability (blue line) and Distilled Student Sentence Probability (gray line) tend to stay at higher probability values.
* The colored bands provide context for the sentence type at each index, allowing for comparison of probabilities based on sentence type.
### Interpretation
The chart suggests that the student-generated sentences have a lower probability, on average, compared to teacher-generated sentences and distilled student sentences. The distilled student sentences appear to have a probability closer to the teacher sentences. The fluctuations in probability for all sentence types indicate variability in the quality or confidence of the sentences at different indices. The colored bands help to understand how the probability of each type of sentence varies depending on whether it is a Teacher, Boosted, Shared, or Student sentence.