\n
## Line Chart with Shaded Regions: Sentence Probability Comparison
### Overview
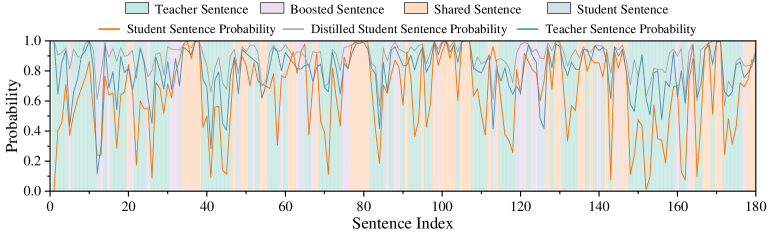
The image displays a line chart overlaid with vertical shaded regions, plotting probability values against a sequence of sentence indices. It compares the probability scores of sentences from a "Teacher" model, a "Student" model, and a "Distilled Student" model across 180 sentence indices. The shaded background categorizes each sentence index by its type (Teacher, Boosted, Shared, or Student).
### Components/Axes
* **Chart Type:** Line chart with categorical background shading.
* **Y-Axis:**
* **Label:** "Probability"
* **Scale:** Linear, ranging from 0.0 to 1.0, with major tick marks at 0.0, 0.2, 0.4, 0.6, 0.8, and 1.0.
* **X-Axis:**
* **Label:** "Sentence Index"
* **Scale:** Linear, ranging from 0 to 180, with major tick marks every 20 units (0, 20, 40, ..., 180).
* **Legend (Top Center):**
* **Shaded Region Categories (from left to right):**
1. `Teacher Sentence` (Light Cyan/Teal fill)
2. `Boosted Sentence` (Light Purple fill)
3. `Shared Sentence` (Light Orange/Peach fill)
4. `Student Sentence` (Light Blue fill)
* **Line Categories (from left to right):**
1. `Student Sentence Probability` (Solid Orange line)
2. `Distilled Student Sentence Probability` (Solid Gray line)
3. `Teacher Sentence Probability` (Solid Blue line)
### Detailed Analysis
The chart visualizes three probability series across 180 data points (sentence indices). The background is segmented into vertical bands of four colors, indicating the type of sentence at each index.
**Line Trends & Approximate Values:**
1. **Teacher Sentence Probability (Blue Line):**
* **Trend:** This line generally maintains the highest probability values, frequently oscillating between ~0.6 and 1.0. It shows high volatility but rarely drops below 0.4.
* **Key Points:** Peaks near 1.0 are common (e.g., around indices 10, 30, 80, 140). Notable troughs occur near index 45 (~0.4) and index 100 (~0.3).
2. **Student Sentence Probability (Orange Line):**
* **Trend:** This line exhibits the most extreme volatility, with sharp, frequent drops to very low probabilities (near 0.0) and recoveries to high values (near 1.0). Its average appears lower than the Teacher line.
* **Key Points:** Deep troughs near 0.0 are visible at indices ~45, ~100, ~125, and ~150. It often peaks near 1.0, especially in regions shaded as "Teacher Sentence" or "Shared Sentence."
3. **Distilled Student Sentence Probability (Gray Line):**
* **Trend:** This line's behavior is intermediate. It is less volatile than the Student line but more volatile than the Teacher line. It often tracks between the other two lines.
* **Key Points:** It frequently dips to values between 0.2 and 0.4 (e.g., indices ~45, ~100) but avoids the near-zero drops seen in the Student line. Its peaks often align with peaks in the Teacher line.
**Shaded Region Distribution:**
The background shading is not uniform. "Teacher Sentence" (cyan) and "Shared Sentence" (orange) regions appear most frequently and in longer contiguous blocks. "Boosted Sentence" (purple) and "Student Sentence" (blue) regions are shorter and more interspersed.
### Key Observations
1. **Correlation with Sentence Type:** The `Teacher Sentence Probability` (blue line) is consistently high within "Teacher Sentence" (cyan) and "Shared Sentence" (orange) shaded regions. The `Student Sentence Probability` (orange line) shows its most severe drops (near 0.0) within "Student Sentence" (blue) and "Boosted Sentence" (purple) regions.
2. **Volatility Hierarchy:** Visual inspection confirms a clear order of volatility: Student Sentence Probability (most volatile) > Distilled Student Sentence Probability > Teacher Sentence Probability (least volatile).
3. **Synchronized Dips:** All three probability lines often dip simultaneously at specific indices (e.g., ~45, ~100, ~125), suggesting these sentences are challenging for all models.
4. **Distillation Effect:** The `Distilled Student` line (gray) consistently acts as a smoothed, intermediate version of the `Student` line (orange), rarely reaching its extreme lows, which suggests the distillation process stabilizes the student's confidence.
### Interpretation
This chart likely illustrates the process and outcomes of **knowledge distillation** in natural language processing, where a smaller "Student" model is trained to mimic a larger "Teacher" model.
* **What the data suggests:** The high and relatively stable probability of the Teacher model indicates it is confident in its predictions across most sentences. The Student model's extreme volatility suggests it is highly uncertain or "confused" on many sentences, particularly those not directly from the teacher ("Student" and "Boosted" types). The Distilled Student model shows improved stability over the base Student, demonstrating the effectiveness of the distillation training.
* **Relationship between elements:** The shaded regions define the *source* or *type* of each training sentence. The lines show the *confidence* (probability) each model assigns to its own prediction for that sentence. The strong alignment of high Teacher probability with "Teacher" and "Shared" regions is expected. The poor Student performance on "Student" and "Boosted" regions highlights areas where the student struggles without direct teacher guidance.
* **Notable patterns:** The synchronized dips are critical—they identify a subset of sentences that are inherently difficult, as even the powerful Teacher model's confidence drops (though less severely). The "Shared Sentence" regions are particularly interesting, as they show where both models' training data overlaps, and here, all models tend to have higher probabilities. The chart effectively argues that distillation (gray line) successfully transfers knowledge, pulling the student's confidence profile closer to the teacher's, especially by preventing catastrophic drops in probability.