## Line Graph: Sentence Probability Analysis
### Overview
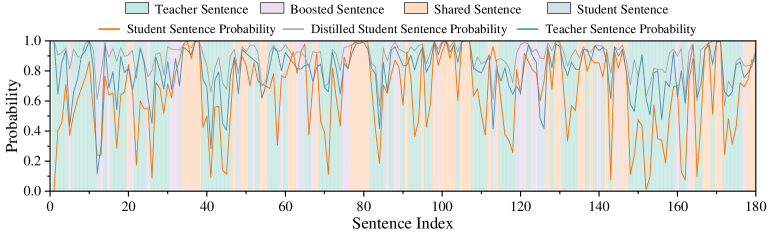
The image is a multi-line line graph comparing sentence probabilities across 180 sentences. It visualizes the relationship between teacher-generated sentences, student-generated sentences, and their respective probability distributions. The graph includes six data series with distinct colors and line styles, overlaid on a background of shaded regions representing sentence categories.
### Components/Axes
- **X-axis (Sentence Index)**: Ranges from 0 to 180, labeled "Sentence Index" with tick marks at intervals of 20.
- **Y-axis (Probability)**: Ranges from 0.0 to 1.0, labeled "Probability" with increments of 0.2.
- **Legend**: Located at the top of the graph, with the following entries:
- **Teacher Sentence**: Light blue shaded region.
- **Boosted Sentence**: Light purple shaded region.
- **Shared Sentence**: Light orange shaded region.
- **Student Sentence**: Dark blue line.
- **Student Sentence Probability**: Orange line.
- **Distilled Student Sentence Probability**: Dashed orange line.
- **Teacher Sentence Probability**: Dark blue line.
### Detailed Analysis
1. **Teacher Sentence Probability (Dark Blue Line)**:
- Fluctuates between ~0.6 and ~0.95 across all sentences.
- Peaks align with high-probability regions in the "Teacher Sentence" shaded area.
- Shows moderate variance, with sharper dips near sentence indices 40, 80, and 120.
2. **Student Sentence Probability (Orange Line)**:
- Mirrors the dark blue line but with reduced amplitude (~0.4–0.85).
- Peaks occur at similar indices (e.g., 20, 60, 100) but with delayed timing (e.g., peak at 60 instead of 40).
- Exhibits higher variance near sentence indices 140–160.
3. **Distilled Student Sentence Probability (Dashed Orange Line)**:
- Smoother than the solid orange line, with reduced peaks (~0.5–0.75).
- Lags behind the solid orange line by ~10–15 sentence indices.
- Shows minimal variance compared to other lines.
4. **Student Sentence (Dark Blue Line)**:
- Overlaps with the "Teacher Sentence Probability" line but with sharper fluctuations.
- Peaks and troughs align with the dark blue line but exhibit greater amplitude.
5. **Shaded Regions**:
- **Teacher Sentence (Light Blue)**: Covers ~70% of the y-axis range, with peaks at indices 20, 60, 100, and 140.
- **Boosted Sentence (Light Purple)**: Narrower peaks at indices 40, 80, and 120, covering ~20–30% of the y-axis.
- **Shared Sentence (Light Orange)**: Broad, low-amplitude regions spanning indices 0–180, covering ~10–20% of the y-axis.
### Key Observations
- **Alignment**: The "Teacher Sentence Probability" (dark blue) and "Student Sentence Probability" (orange) lines show correlated peaks but with a phase shift (student peaks occur later).
- **Distillation Effect**: The dashed orange line ("Distilled Student Sentence Probability") suggests a smoothing or refinement process, reducing variance but introducing lag.
- **Anomalies**:
- At sentence index 100, the "Boosted Sentence" (light purple) peaks sharply (~0.9), while other lines show minimal activity.
- The "Shared Sentence" (light orange) region remains consistently low (~0.1–0.3) across all indices.
### Interpretation
The graph demonstrates a comparative analysis of sentence generation models:
1. **Teacher vs. Student**: The teacher's sentences (dark blue) serve as a ground truth, while the student's predictions (orange) attempt to mimic them but with delayed and less confident peaks.
2. **Distillation Impact**: The dashed orange line indicates that distillation reduces noise but sacrifices temporal alignment, possibly prioritizing stability over accuracy.
3. **Boosted/Shared Sentences**: These categories represent auxiliary data, with "Boosted" showing targeted high-probability regions and "Shared" reflecting baseline or common patterns.
The data suggests that while student models can approximate teacher outputs, they require refinement (distillation) to improve reliability, albeit at the cost of real-time alignment. The "Boosted" and "Shared" categories may highlight specific linguistic features or collaborative patterns in the dataset.