## Dual-Axis Line Chart: Token Length and Pass Rate over RL Training Steps
### Overview
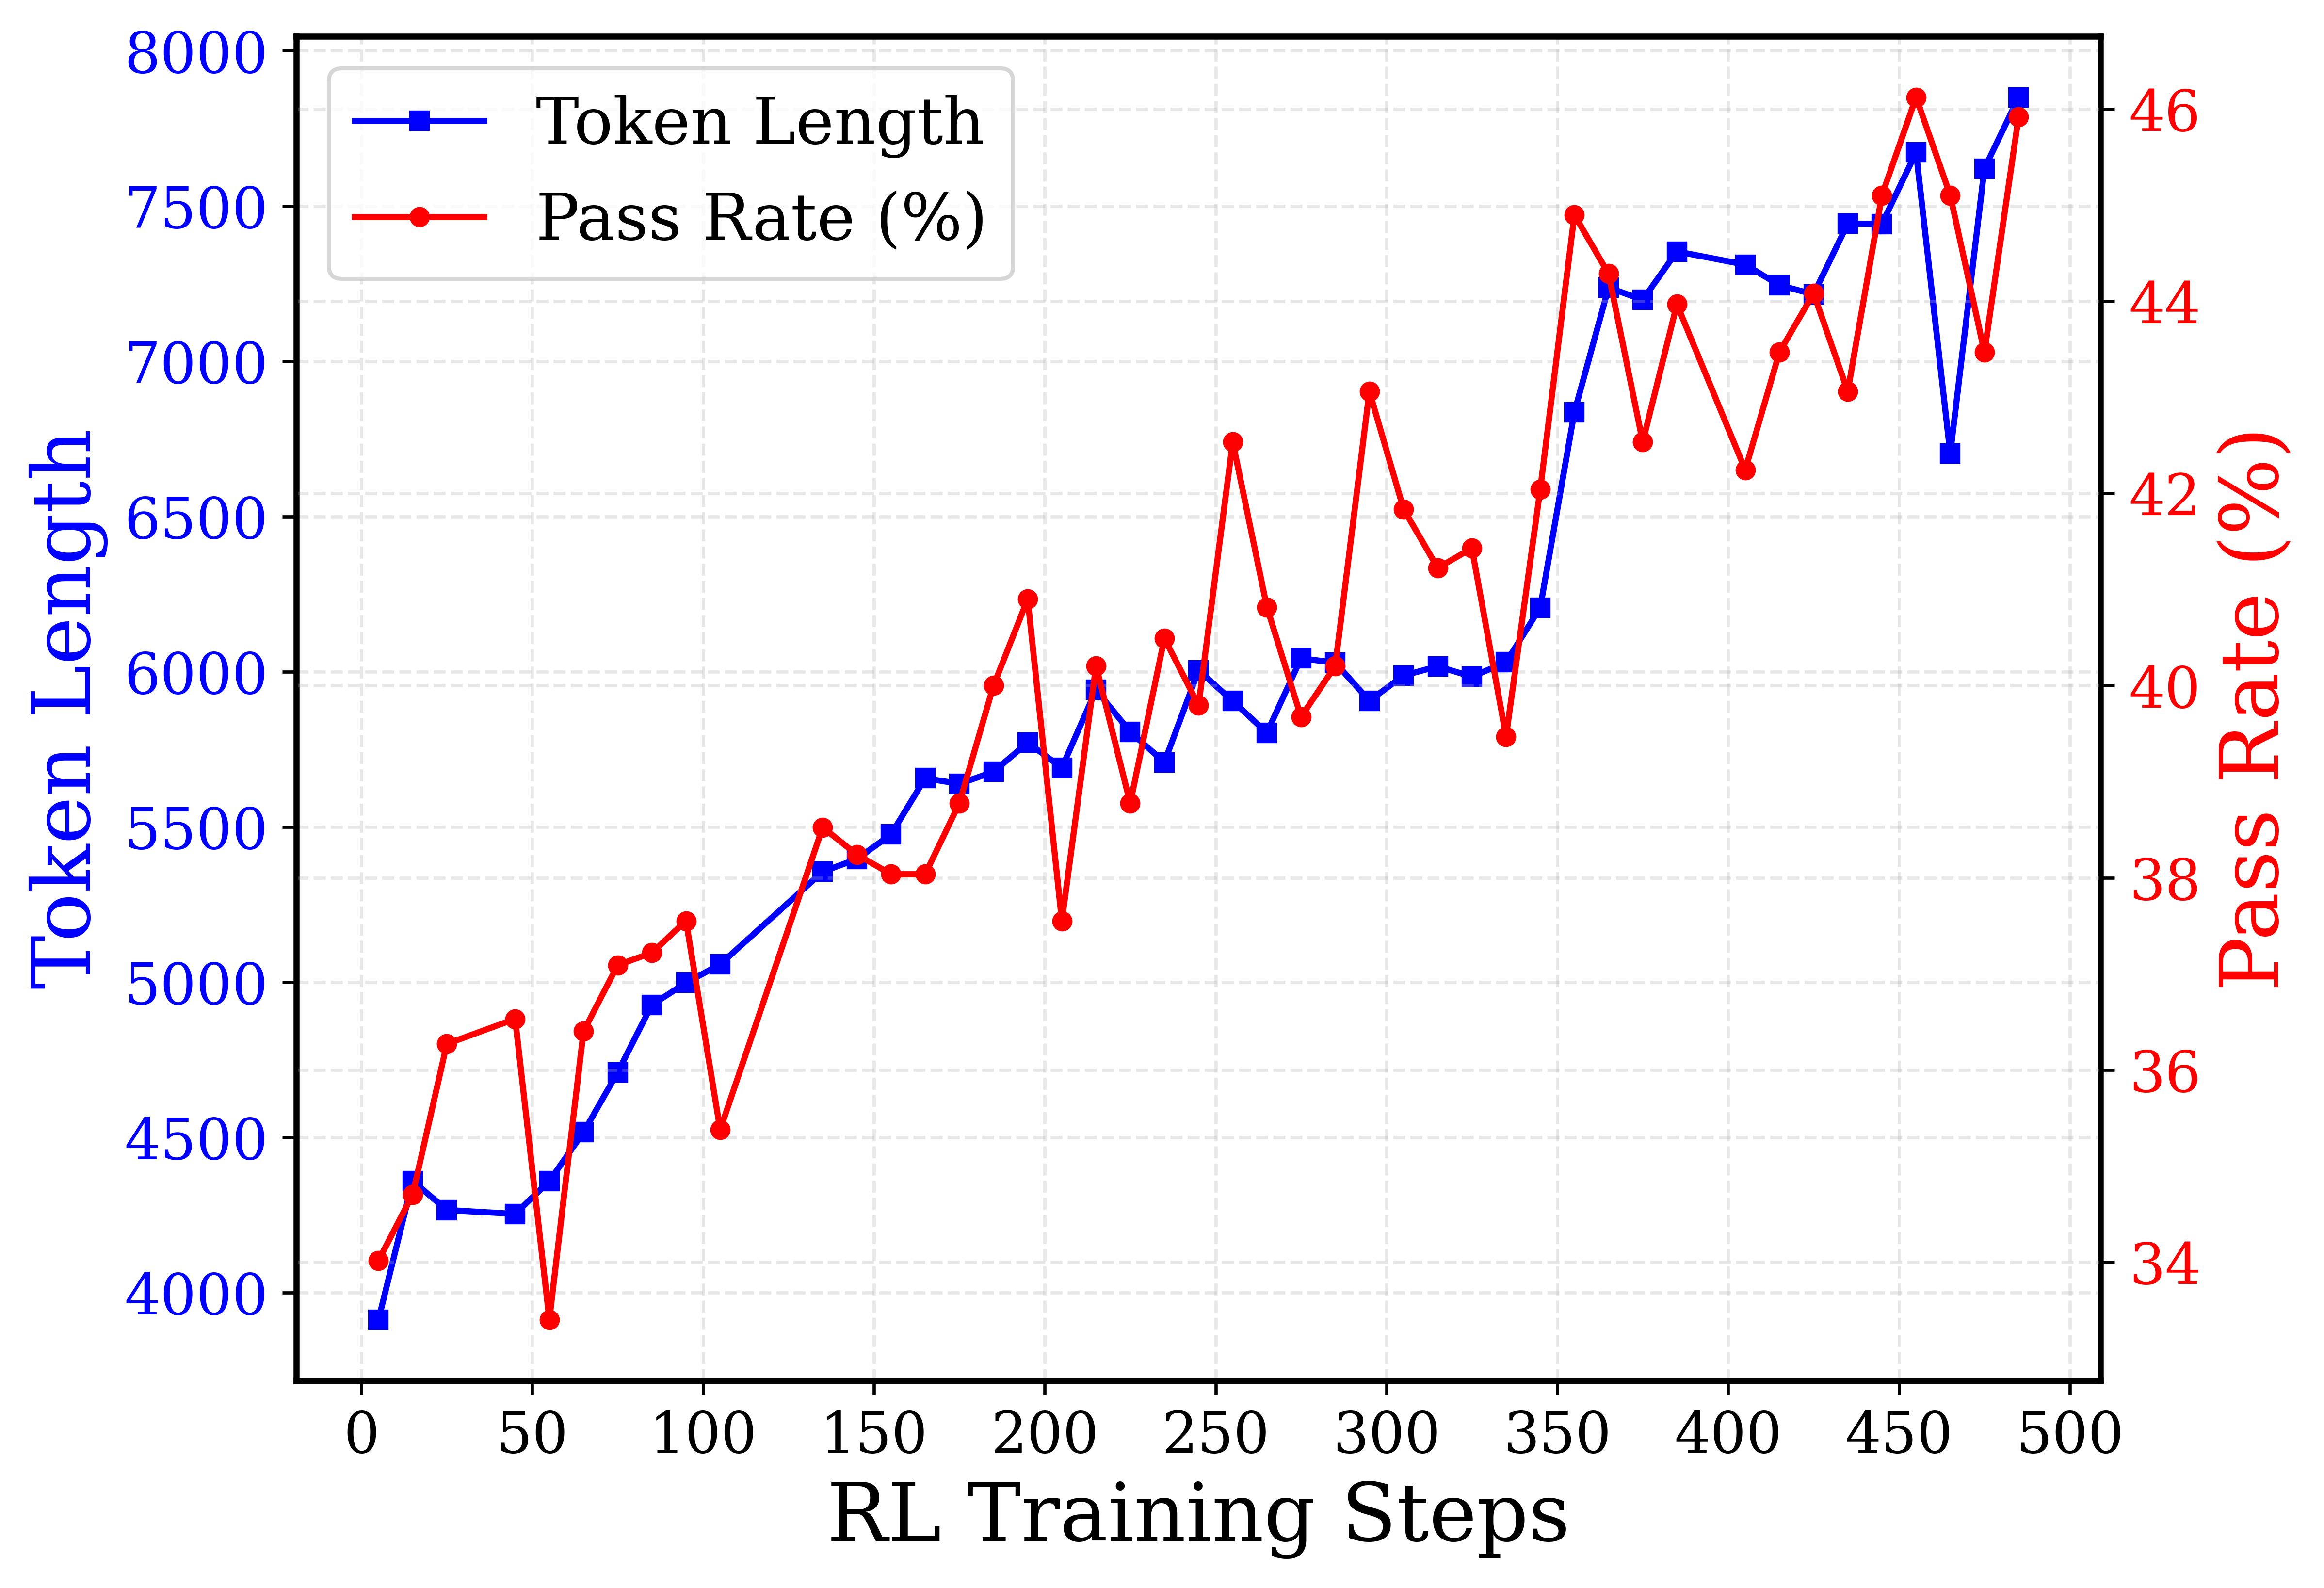
This image is a dual-axis line chart illustrating the progression of two distinct metrics—"Token Length" and "Pass Rate (%)"—over a series of "RL Training Steps." The chart demonstrates how the length of generated tokens and the success rate evolve simultaneously during a Reinforcement Learning (RL) training process.
### Components/Axes
The chart is composed of the following isolated components:
* **Legend (Top-Left):**
* Enclosed in a rounded rectangular box with a light gray border.
* Displays a blue line with a square marker labeled "Token Length".
* Displays a red line with a circular marker labeled "Pass Rate (%)".
* **X-Axis (Bottom):**
* **Label:** "RL Training Steps" (Black text, centered).
* **Scale:** Ranges from 0 to 500.
* **Markers:** Major tick marks at intervals of 50 (0, 50, 100, 150, 200, 250, 300, 350, 400, 450, 500).
* **Primary Y-Axis (Left):**
* **Label:** "Token Length" (Blue text, rotated 90 degrees counter-clockwise).
* **Scale:** Ranges from 4000 to 8000.
* **Markers:** Major tick marks at intervals of 500 (4000, 4500, 5000, 5500, 6000, 6500, 7000, 7500, 8000).
* **Color Association:** Corresponds to the blue line with square markers.
* **Secondary Y-Axis (Right):**
* **Label:** "Pass Rate (%)" (Red text, rotated 90 degrees clockwise).
* **Scale:** Ranges from 34 to 46.
* **Markers:** Major tick marks at intervals of 2 (34, 36, 38, 40, 42, 44, 46).
* **Color Association:** Corresponds to the red line with circular markers.
* **Grid:** A background grid of light gray, dashed lines aligns with the major tick marks of all three axes.
### Detailed Analysis
#### Trend Verification
* **Token Length (Blue Line/Squares):** The visual trend slopes upward over time. It begins just below 4000 at step ~5, rises steadily with minor fluctuations until step ~340, experiences a sharp, steep climb between steps 340 and 370, plateaus slightly, suffers a severe, isolated drop at step ~465, and immediately recovers to reach its peak near 7800 at the final step.
* **Pass Rate (Red Line/Circles):** The visual trend also slopes upward but exhibits extreme volatility (high variance). It starts near 34%, jumps rapidly, and then oscillates wildly with deep valleys (e.g., at steps ~55, ~105, ~205) and sharp peaks. Despite the jaggedness, the overall trajectory moves from the mid-30s to the mid-40s, peaking just below 47% near step 455.
#### Reconstructed Data Table
*Note: All values are approximate (±) based on visual extraction relative to the gridlines.*
| Estimated RL Step (X) | Token Length (Blue Y) | Pass Rate % (Red Y) |
| :--- | :--- | :--- |
| ~5 | 3900 | 34.2 |
| ~15 | 4350 | 35.2 |
| ~25 | 4250 | 36.8 |
| ~45 | 4250 | 37.1 |
| ~55 | 4350 | 33.7 |
| ~65 | 4500 | 37.0 |
| ~75 | 4700 | 37.8 |
| ~85 | 4900 | 37.9 |
| ~95 | 5000 | 38.3 |
| ~105 | 5050 | 35.8 |
| ~135 | 5350 | 38.6 |
| ~145 | 5400 | 38.2 |
| ~155 | 5450 | 38.1 |
| ~165 | 5650 | 38.1 |
| ~175 | 5650 | 39.0 |
| ~185 | 5650 | 40.0 |
| ~195 | 5750 | 41.0 |
| ~205 | 5650 | 37.2 |
| ~215 | 5950 | 40.2 |
| ~225 | 5800 | 38.6 |
| ~235 | 5700 | 40.5 |
| ~245 | 6000 | 39.8 |
| ~255 | 5900 | 42.8 |
| ~265 | 5800 | 40.8 |
| ~275 | 6050 | 39.6 |
| ~285 | 6050 | 40.2 |
| ~295 | 5900 | 43.4 |
| ~305 | 5950 | 42.0 |
| ~315 | 6000 | 41.3 |
| ~325 | 5950 | 41.5 |
| ~335 | 6000 | 39.3 |
| ~345 | 6200 | 42.2 |
| ~355 | 6850 | 45.5 |
| ~365 | 7250 | 44.8 |
| ~375 | 7200 | 42.8 |
| ~385 | 7350 | 44.4 |
| ~405 | 7300 | 42.5 |
| ~415 | 7250 | 43.8 |
| ~425 | 7200 | 44.5 |
| ~435 | 7450 | 43.4 |
| ~445 | 7450 | 45.7 |
| ~455 | 7650 | 46.8 |
| ~465 | 6700 | 45.7 |
| ~475 | 7600 | 43.8 |
| ~485 | 7850 | 46.6 |
### Key Observations
1. **Macro Correlation:** There is a clear, positive macro-correlation between the two metrics. As training steps increase, both the token length and the pass rate increase.
2. **Volatility Discrepancy:** The Pass Rate (red) is significantly more volatile step-to-step than the Token Length (blue). Token length tends to grow in a more stable, step-wise fashion, whereas pass rate swings wildly between consecutive measurements.
3. **The Step 350 Inflection:** Around step 340-350, there is a massive, concurrent spike in both metrics. Token length jumps from ~6000 to ~7250, and pass rate jumps from ~39% to ~45%.
4. **The Step 465 Anomaly:** At approximately step 465, the Token Length experiences a severe, sudden drop (from ~7650 down to ~6700). Interestingly, the Pass Rate does *not* suffer a corresponding catastrophic drop at this exact step, remaining relatively high at ~45.7%.
### Interpretation
This chart visualizes the behavioral evolution of a Large Language Model (LLM) undergoing Reinforcement Learning (likely RLHF - Reinforcement Learning from Human Feedback, or similar).
**Reading between the lines:**
The data strongly suggests that the model is learning a strategy where **verbosity correlates with success**. Because the "Pass Rate" generally improves as the "Token Length" increases, the RL reward function is likely inadvertently (or intentionally) rewarding longer outputs. This is a common phenomenon in LLM training; models learn that providing exhaustive, step-by-step reasoning (Chain-of-Thought) or simply covering more information increases the statistical likelihood of hitting the criteria required to "pass" a prompt's evaluation.
The high volatility in the Pass Rate indicates that the training process is noisy. The model is likely exploring different policy updates, some of which fail dramatically on specific batches of data (causing the sharp red dips).
The anomaly at step 465 is particularly revealing. The model suddenly generated much shorter responses, yet maintained a high pass rate. This could indicate a specific batch of training data that required concise answers, or a temporary policy shift that was quickly corrected in the subsequent step. Ultimately, the chart demonstrates a successful, albeit noisy, training run where the model doubles its output length to achieve a ~12% absolute increase in its pass rate.