## Line Chart: Token Length and Pass Rate vs. RL Training Steps
### Overview
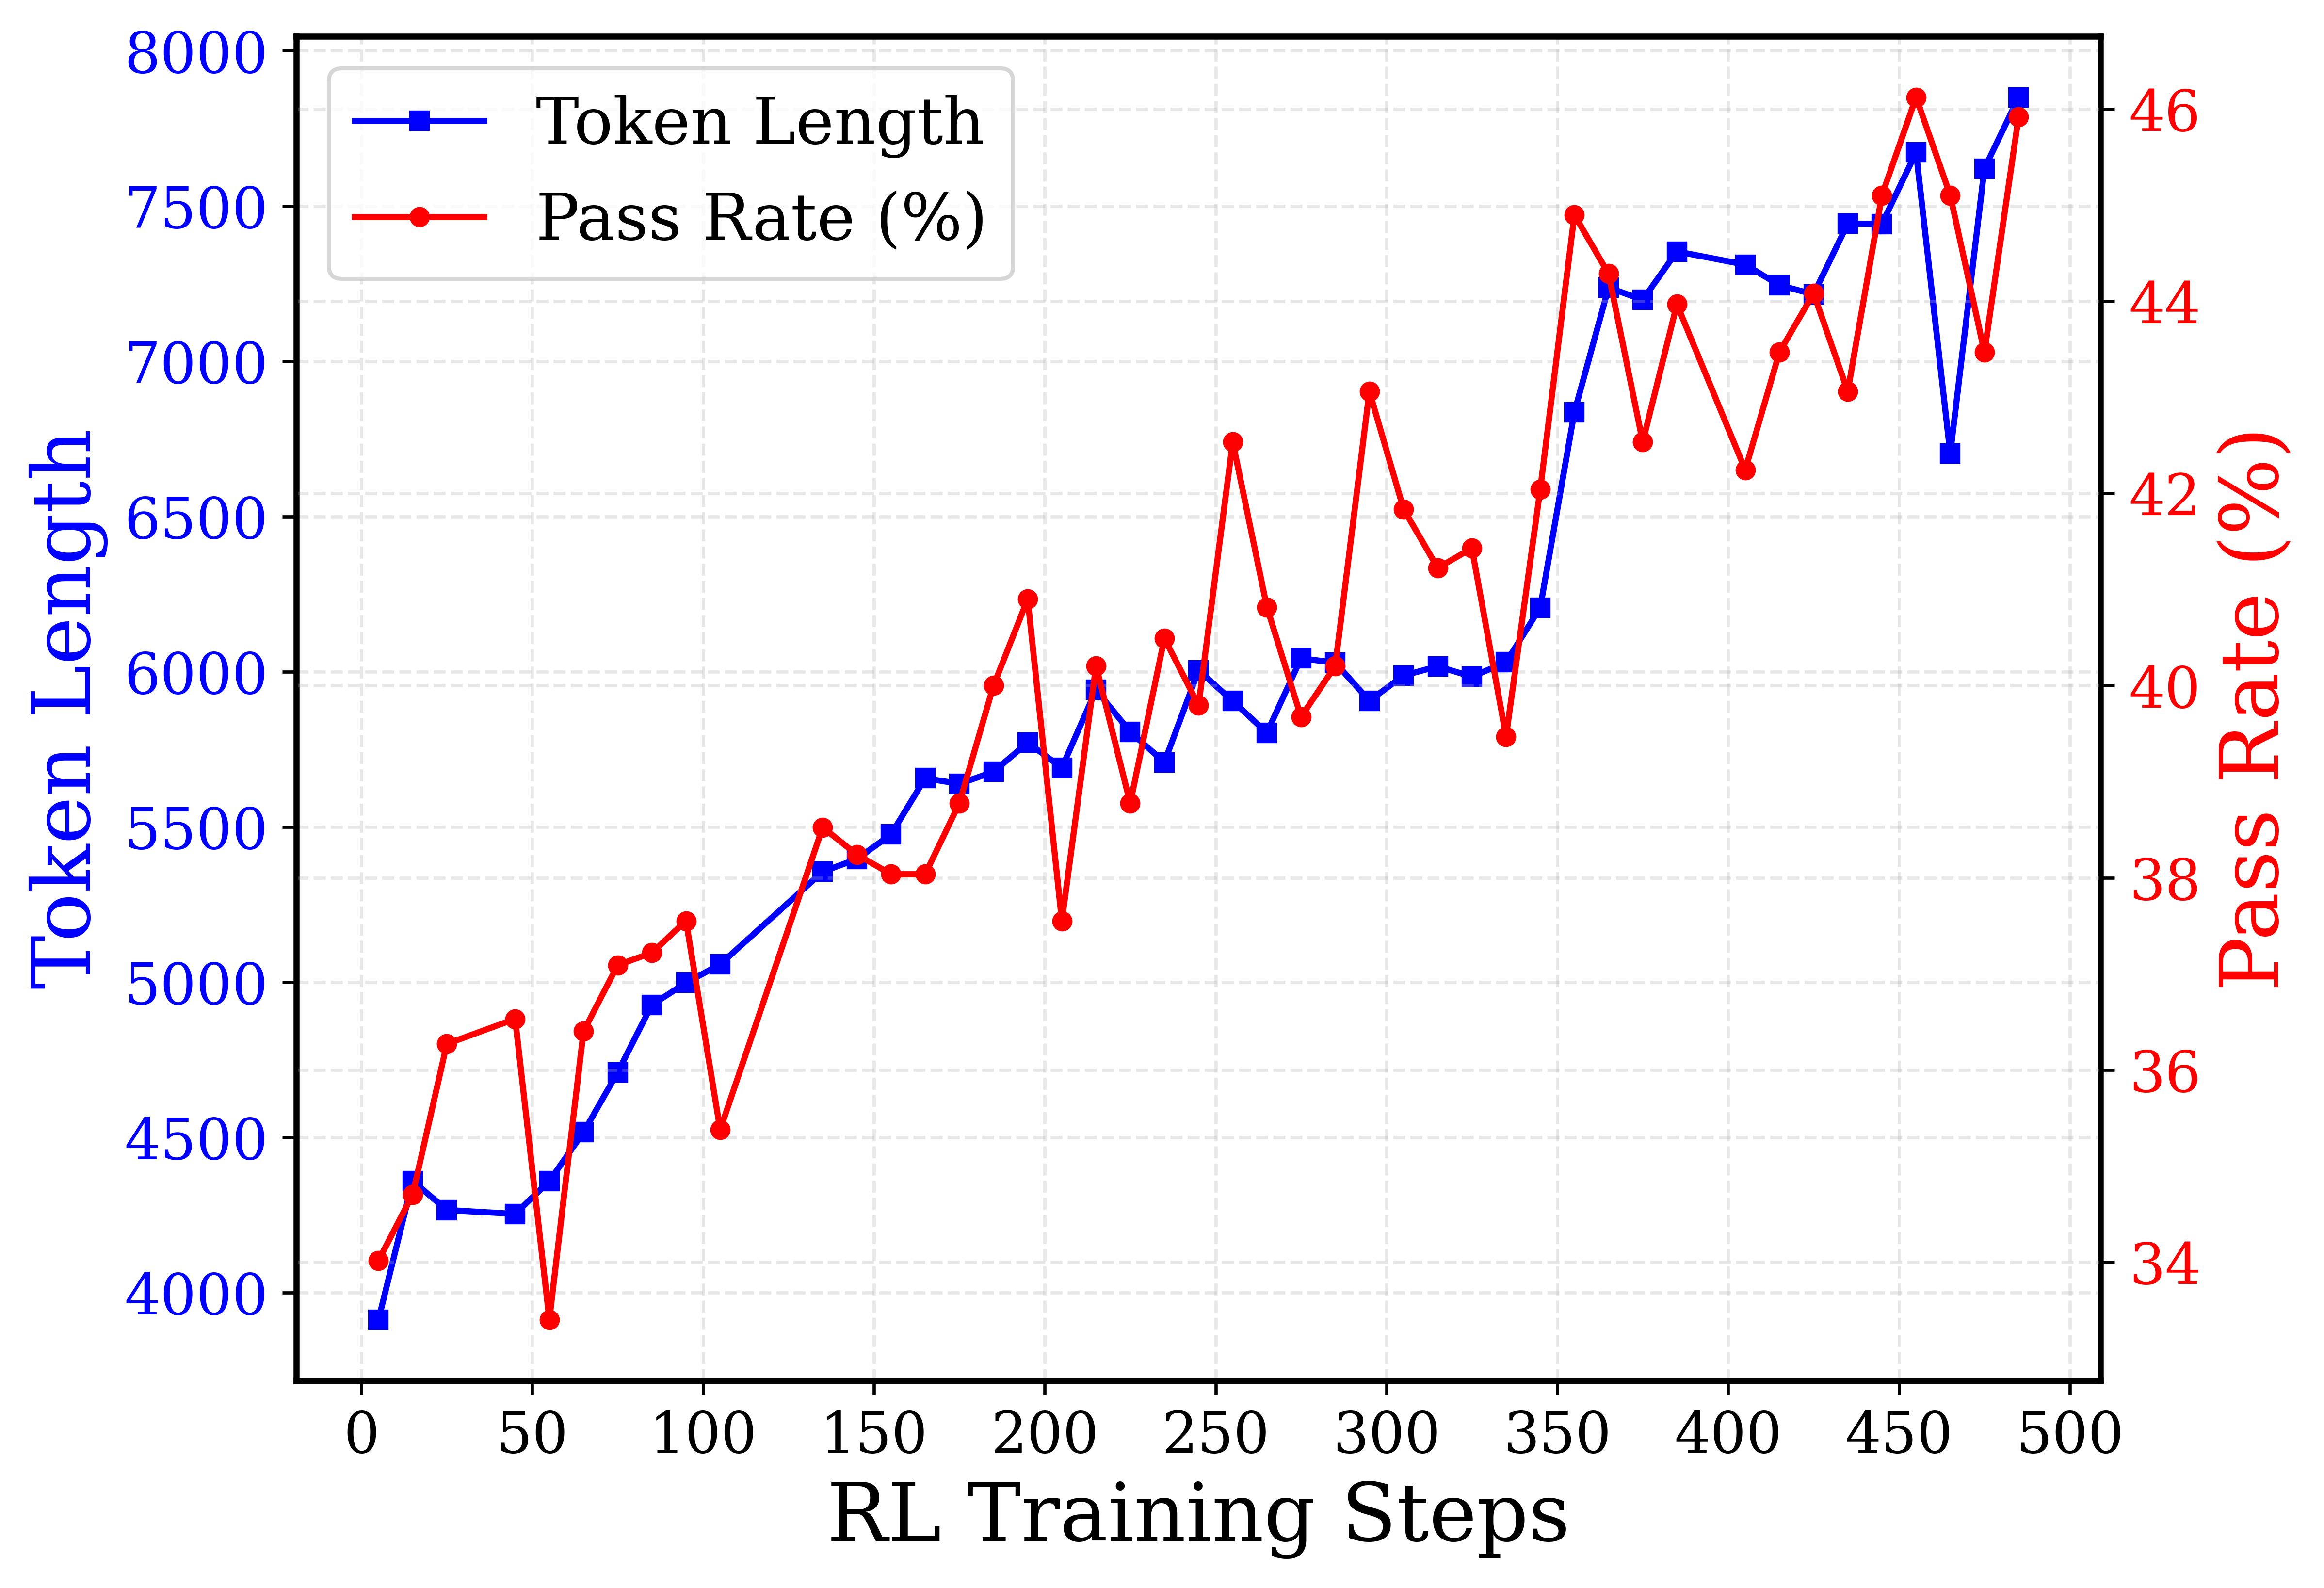
The image is a line chart showing the relationship between RL Training Steps (x-axis) and two metrics: Token Length (left y-axis) and Pass Rate (%) (right y-axis). The chart displays how these metrics change as the RL training progresses.
### Components/Axes
* **X-axis:** RL Training Steps, ranging from 0 to 500 in increments of 50.
* **Left Y-axis:** Token Length, ranging from 4000 to 8000 in increments of 500. Labelled in blue.
* **Right Y-axis:** Pass Rate (%), ranging from 34 to 46 in increments of 2. Labelled in red.
* **Legend:** Located in the top-left corner.
* Blue line with square markers: Token Length
* Red line with circle markers: Pass Rate (%)
### Detailed Analysis
* **Token Length (Blue):**
* Trend: Generally increasing with fluctuations.
* Data Points:
* At 0 steps, Token Length is approximately 3900.
* At 50 steps, Token Length is approximately 4300.
* At 100 steps, Token Length is approximately 4900.
* At 150 steps, Token Length is approximately 5400.
* At 200 steps, Token Length is approximately 5800.
* At 250 steps, Token Length is approximately 5900.
* At 300 steps, Token Length is approximately 6000.
* At 350 steps, Token Length is approximately 6000.
* At 400 steps, Token Length is approximately 7300.
* At 450 steps, Token Length is approximately 7400.
* At 500 steps, Token Length is approximately 6700.
* **Pass Rate (%) (Red):**
* Trend: Generally increasing with significant fluctuations.
* Data Points:
* At 0 steps, Pass Rate is approximately 34.5%.
* At 50 steps, Pass Rate is approximately 35%.
* At 100 steps, Pass Rate is approximately 38%.
* At 150 steps, Pass Rate is approximately 39%.
* At 200 steps, Pass Rate is approximately 37%.
* At 250 steps, Pass Rate is approximately 41%.
* At 300 steps, Pass Rate is approximately 43%.
* At 350 steps, Pass Rate is approximately 39%.
* At 400 steps, Pass Rate is approximately 41%.
* At 450 steps, Pass Rate is approximately 45%.
* At 500 steps, Pass Rate is approximately 46%.
### Key Observations
* Both Token Length and Pass Rate generally increase with RL Training Steps, but the Pass Rate exhibits more volatility.
* There are periods where the Pass Rate decreases while the Token Length continues to increase, suggesting a complex relationship between these metrics.
* The Pass Rate has a large spike at the end of the training steps.
### Interpretation
The chart suggests that as the RL model trains, it tends to generate longer tokens, and the pass rate generally improves. However, the fluctuations in pass rate indicate that simply increasing token length does not guarantee better performance. The model's performance, as measured by the pass rate, is likely influenced by other factors not captured in this chart. The final spike in pass rate at the end of the training steps could indicate a significant improvement in the model's ability to generate successful tokens towards the end of the training process, or could be an outlier. Further investigation would be needed to determine the cause of this spike.